1. Introduction & Overview

✅ What is Data Democratization?
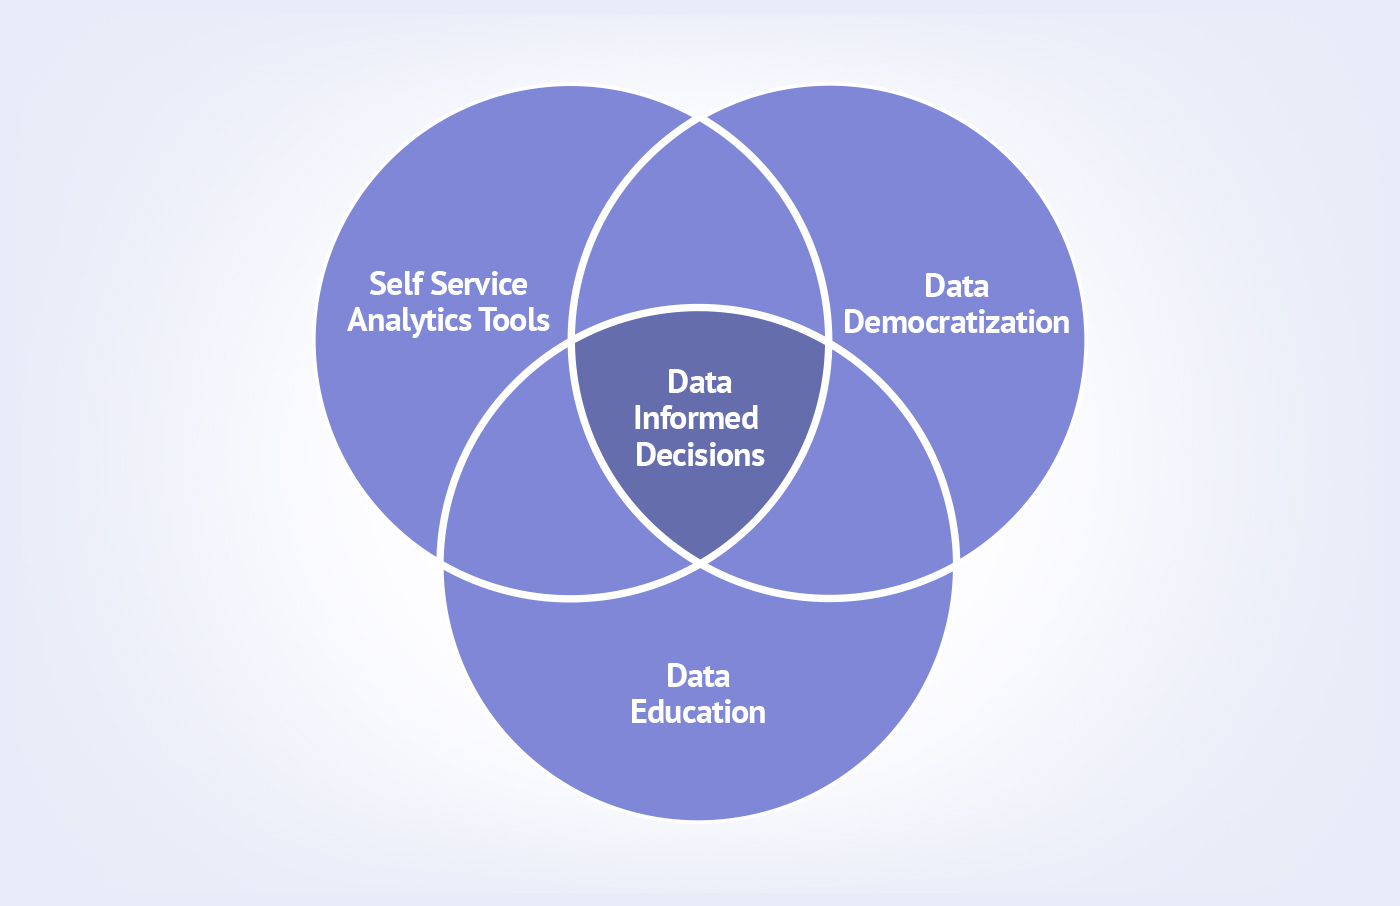
Data Democratization is the process of making data accessible to non-technical users across an organization without needing help from IT or data teams. The goal is to empower all employees—whether in development, security, or operations—to make data-driven decisions quickly and securely.
🧠 Key Idea: Everyone should have access to data without barriers but with security, compliance, and governance controls in place.
📜 History or Background
- Traditional Model: Data was siloed within BI teams or specific departments.
- Rise of Self-Service BI: Tools like Tableau, Power BI emerged, enabling users to generate their own insights.
- Modern Need: In DevSecOps, fast decision-making on code vulnerabilities, pipeline failures, or policy violations needs real-time access to secure and contextual data.
- Cloud-Native Shift: Cloud and microservices further demanded decentralized data availability, governed by shared security practices.
🔐 Why Is It Relevant in DevSecOps?
- DevSecOps is about integrating security across Dev + Sec + Ops pipelines.
- Real-time access to metrics, logs, vulnerabilities, compliance checks is critical.
- Data Democratization ensures:
- Developers see security issues in their CI builds.
- Security teams view deployment metadata.
- Operations can audit policy violations immediately.
- Encourages shared responsibility via shared data access.
2. Core Concepts & Terminology
🧩 Key Terms
| Term | Description |
|---|---|
| Self-Service Data | Users can query or visualize data without engineering support |
| Data Governance | Ensuring compliance, quality, and security while sharing data |
| Data Fabric | Architecture enabling unified access to distributed data |
| Policy-as-Code | Policies written in code to automate access and controls |
| Observability Data | Logs, metrics, traces accessible to all teams |
🔄 How It Fits into DevSecOps Lifecycle
| DevSecOps Phase | Role of Data Democratization |
|---|---|
| Plan | Product teams access past incidents, trends, vulnerabilities |
| Develop | Developers use security data while coding (e.g., SBOM reports) |
| Build | Access build time security scan reports, test data |
| Test | Testers can compare code performance/security test data |
| Release | Stakeholders see release approval data, change risk scores |
| Deploy | Infra as code and policy enforcement metadata is available |
| Operate | Operations analyze system behavior using real-time logs |
| Monitor | Security and ops share monitoring dashboards and alerts |
3. Architecture & How It Works
🏗️ Components
- Data Sources: CI/CD logs, code scans, containers, cloud configs
- Ingestion Layer: Collects and normalizes data (e.g., Fluentd, Logstash)
- Storage Layer: Centralized (Data Lakes) or Decentralized (Data Mesh)
- Access Layer: APIs, dashboards (Grafana, Kibana, Superset)
- Governance Layer: Role-based access control, encryption, audit trails
- Automation Layer: CI/CD pipelines triggering data syncs, alerts
🔁 Internal Workflow
- CI/CD pipeline generates build and scan logs.
- Logs ingested to central storage with tagging (team, app, env).
- Policies apply access control using tools like OPA or HashiCorp Sentinel.
- Dashboards or APIs expose the filtered data per role (e.g., developers vs auditors).
- Alerts are triggered on anomalies or violations.
🧭 Architecture Diagram (Described)
(Textual Description)
- Left Side: Jenkins → GitHub Actions → Static Analysis Tools → Logs
- Middle: Ingestion (Fluentd) → Policy Control (OPA) → Data Lake
- Right Side: Role-Based Dashboards (Grafana) → Alerts (Slack, Email)
- Governance Layer across all → Logging, RBAC, Encryption
🔌 Integration Points
- CI/CD Tools: Jenkins, GitHub Actions, GitLab → Expose artifacts & logs
- Security Scanners: Snyk, SonarQube → Push scan results
- Cloud Platforms: AWS CloudTrail, Azure Monitor → Feed runtime data
- Dashboards: Grafana, Redash → Query & display democratized data
4. Installation & Getting Started
⚙️ Prerequisites
- Basic DevSecOps toolchain setup (Jenkins/GitHub + scanners + monitoring)
- Container or VM for data platform (e.g., OpenMetadata, Superset, or Grafana)
- Knowledge of RBAC, API tokens, data formats (JSON, YAML)
🧪 Step-by-Step: Open Source Setup (Example with Superset)
- Install Docker & Docker Compose
sudo apt update && sudo apt install docker.io docker-compose2. Download Apache Superset
git clone https://github.com/apache/superset.git
cd superset
3. Run Setup
docker-compose -f docker-compose-non-dev.yml up 4. Login
Visit: http://localhost:8088, default login: admin/admin
5. Connect Data Source
- Click + Database
- Add PostgreSQL/Prometheus/Elasticsearch data with secure creds
6. Create Dashboards
- Use the SQL Lab or pre-built templates
- Share role-specific views with Dev, Sec, Ops teams
5. Real-World Use Cases
1. DevSecOps Pipeline Transparency
- Teams access build security scan results (Snyk/Trivy) from shared dashboards.
- Data is tagged by repo, environment, and commit hash.
2. Security Incident Response
- Logs and alerts available to both SecOps and DevOps.
- Democratized access reduces MTTR (Mean Time to Recovery).
3. Compliance Auditing
- Auditors access role-filtered access logs, scan results, SBOMs.
- No need to request snapshots from IT.
4. Cloud Cost Optimization
- Developers see real-time usage data (e.g., AWS Cost Explorer) to optimize infra provisioning.
6. Benefits & Limitations
✅ Benefits
- 📈 Faster, data-driven decision making
- 🤝 Collaboration between Dev, Sec, and Ops
- 🔒 Enforces security through visibility
- ⚖️ Compliance becomes continuous, not periodic
⚠️ Limitations
| Limitation | Description |
|---|---|
| Access Overload | Too much data can confuse users |
| Security Risk | Poor access control can lead to leaks |
| Data Quality | Unverified data may lead to wrong conclusions |
| Tool Sprawl | Multiple dashboards/tools increase complexity |
7. Best Practices & Recommendations
🛡️ Security & Compliance
- Implement RBAC (Role-Based Access Control)
- Use policy-as-code for access and retention
- Enable audit logging and immutable logs
- Regular compliance mapping (e.g., SOC2, ISO27001)
⚙️ Automation
- Auto-tagging of pipeline metadata
- Sync logs to data lake after every build
- Auto-remove access after TTL (time-to-live)
🧠 Performance & Maintenance
- Regular cleanup of old logs
- Monitor dashboard usage
- Archive static data
8. Comparison with Alternatives
| Approach | Data Democratization | Traditional Reporting | SIEM Platforms |
|---|---|---|---|
| Speed | Real-time | Delayed | Real-time |
| Audience | Dev + Sec + Ops | Executives | Security |
| Customization | High | Low | Medium |
| Learning Curve | Moderate | Low | High |
| Security Built-in | Needs enforcement | Often weak | Strong (but siloed) |
When to Choose Data Democratization:
- You need collaboration across teams
- Real-time visibility is needed
- Compliance must be continuous
9. Conclusion
Data Democratization in DevSecOps bridges the gap between security, development, and operations through secure, governed, and shared access to critical data. By breaking silos and enabling real-time insights, teams can collaboratively secure and optimize the software lifecycle.