1. Introduction & Overview
What is Data Observability?
Data Observability is the ability to fully understand the health, lineage, and performance of data across your infrastructure. In a DevSecOps context, it ensures that data pipelines are trustworthy, auditable, and compliant—especially critical when automating deployments, ensuring security, and meeting regulatory requirements.
Data observability incorporates:
- Monitoring
- Alerting
- Logging
- Tracing
- Data lineage & quality checks
History or Background
- Origin: Coined around 2020, evolving from the need to apply software observability concepts (logs, metrics, traces) to data pipelines and data assets.
- Drivers: Rise in data-driven decision-making, GDPR/CCPA regulations, ML/AI use-cases, and cloud-native architectures.
- Tools that popularized it: Monte Carlo, Databand (IBM), Acceldata, OpenLineage, and Apache Airflow.
Why is it Relevant in DevSecOps?
- Security: Detect unauthorized data access or anomalies in real-time.
- Compliance: Ensure traceability and audit trails for regulations (e.g., HIPAA, SOC 2).
- Automation: Prevent deployment of broken data pipelines in CI/CD workflows.
- Reliability: Early detection of broken jobs, schema changes, and failed ETLs.
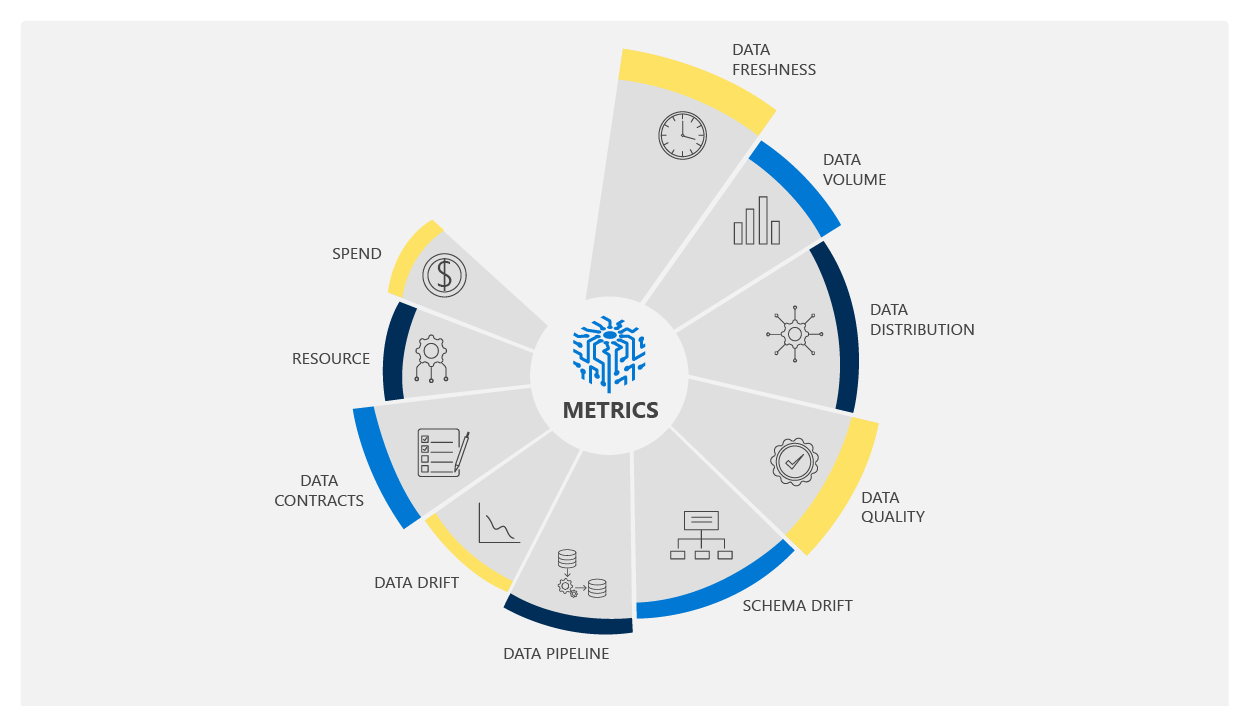
2. Core Concepts & Terminology
Key Terms
| Term | Definition |
|---|---|
| Data Lineage | The path that data follows as it moves through the system. |
| Data Quality | Accuracy, completeness, consistency, and validity of data. |
| Data Freshness | Timeliness of data availability. |
| Anomaly Detection | Identifying unusual patterns or outliers in datasets. |
| Schema Drift | Changes in structure of the data that can break pipelines. |
How It Fits into the DevSecOps Lifecycle
| DevSecOps Phase | Data Observability Role |
|---|---|
| Plan | Identify data dependencies and governance risks. |
| Develop | Monitor dataset versions and changes during development. |
| Build | Integrate checks into CI/CD pipelines (e.g., failing builds with broken data). |
| Test | Run automated data validation tests. |
| Release | Tag datasets with metadata before promotion. |
| Operate | Continuously monitor pipelines for freshness, lineage, and anomalies. |
| Monitor | Real-time alerting and dashboards for SLA/SLO compliance. |
3. Architecture & How It Works
Components
- Data Collectors – Agents that track metadata, logs, and metrics from pipelines (e.g., Airflow, Spark).
- Metadata Store – Stores information like schema, freshness, and lineage.
- Monitoring Engine – Detects anomalies, schema changes, and freshness issues.
- Alerting & Dashboard Layer – Notifies users through Slack, PagerDuty, etc.
- APIs / CI Integrations – Hooks for GitHub Actions, GitLab CI, Jenkins, etc.
Internal Workflow
- Ingest Metadata: Collect data pipeline logs, schema snapshots, and job runtimes.
- Analyze: Apply statistical models to determine data health.
- Visualize: Show DAGs, lineage graphs, and health indicators.
- Alert: Raise notifications for data downtime or corruption.
- Remediate: Trigger rollbacks or hold CI/CD releases.
Architecture Diagram (Descriptive)
Imagine a layered architecture:
          ┌──────────────────────────┐
          │     CI/CD Pipeline       │
          └────────▲─────────────────┘
                   │
          ┌────────┴───────────────┐
          │ Data Observability API │
          └────────▲────┬──────────┘
                   │    │
        ┌──────────┘    └───────────┐
        ▼                           ▼
┌────────────┐             ┌─────────────────┐
│ Metadata DB│◄────────────│ Data Collectors │
└────────────┘             └─────────────────┘
        │                           ▲
        ▼                           │
┌────────────┐             ┌────────────────────┐
│ Monitoring │◄────────────│ Airflow/Spark Logs │
└────────────┘             └────────────────────┘
        ▼
┌────────────┐
│ Alerting UI│
└────────────┘
Integration Points with CI/CD or Cloud Tools
- CI/CD Integration:
- Jenkins: Fail builds if pipeline health checks fail.
- GitHub Actions: Pre-deployment checks for schema drift.
- GitLab CI: Use custom scripts to validate datasets.
- Cloud Platforms:
- AWS Glue, S3, Redshift
- GCP BigQuery, Cloud Composer
- Azure Data Factory, Synapse
4. Installation & Getting Started
Basic Setup or Prerequisites
- Python 3.8+
- Apache Airflow or Spark (optional)
- Postgres/MySQL for metadata store
- Cloud storage or warehouse (S3, BigQuery, etc.)
Hands-On: Step-by-Step Setup (Using Open Source Tools)
Step 1: Install Great Expectations
pip install great_expectations
Step 2: Initialize a Project
great_expectations init
Step 3: Create Expectations
great_expectations suite new
Follow the CLI to define:
- Null checks
- Range checks
- Uniqueness constraints
Step 4: Integrate with CI (GitHub Actions)
# .github/workflows/data-quality.yml
name: Data Quality

on: [push]

jobs:
  validate:
    runs-on: ubuntu-latest
    steps:
    - uses: actions/checkout@v2
    - name: Setup Python
      uses: actions/setup-python@v2
    - name: Install Dependencies
      run: pip install great_expectations
    - name: Run Data Quality Checks
      run: great_expectations checkpoint run my_checkpoint
5. Real-World Use Cases
Use Case 1: Preventing Deployment of Broken Pipelines
- Tool: Monte Carlo + GitLab CI
- Result: Blocked release when schema mismatch detected between staging and prod
Use Case 2: Compliance Reporting in Financial Sector
- Tool: Acceldata
- Use: Track lineage for audit logs
- Compliance: SOX, GDPR
Use Case 3: Monitoring Machine Learning Feature Stores
- Tool: WhyLabs
- Detects drift in real-time ML input features
- Ensures reliability of production ML models
Use Case 4: Healthcare Data Accuracy
- Tool: Great Expectations
- Use: Validate EHR datasets against compliance rules
- Industry: Healthcare (HIPAA-bound)
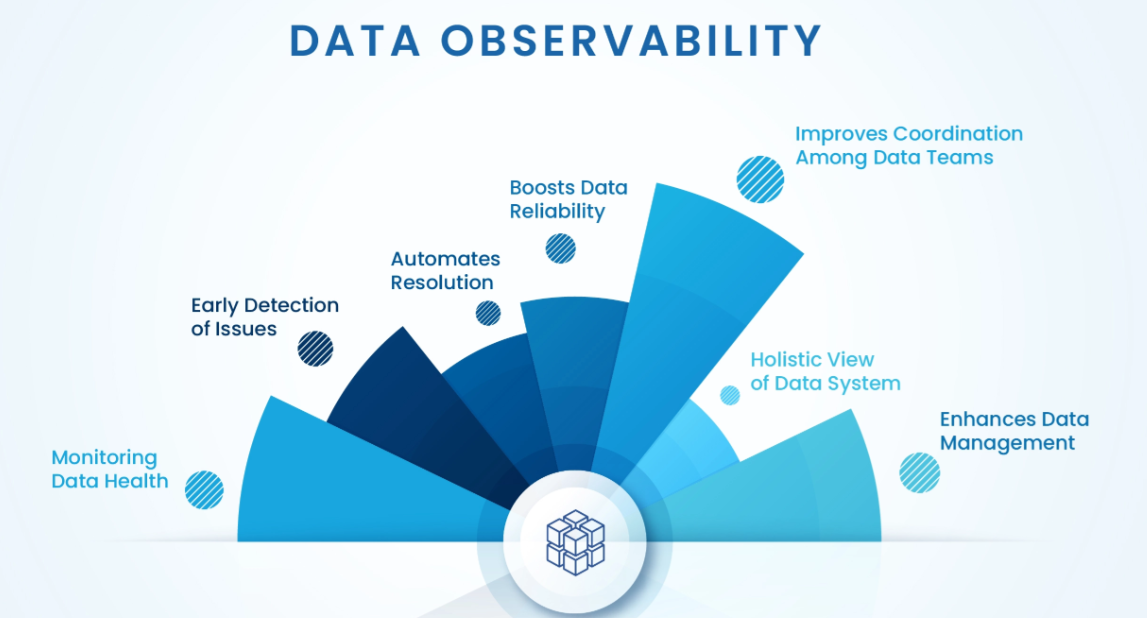
6. Benefits & Limitations
Benefits
- Early detection of data issues
- Improved trust in data-driven decisions
- Compliance-ready audit trails
- Facilitates DevSecOps automation
Limitations
- False positives in anomaly detection
- Overhead in maintaining expectations
- Requires domain knowledge for meaningful alerts
- Tooling maturity still evolving in open-source space
7. Best Practices & Recommendations
Security Tips
- Secure metadata stores with RBAC
- Encrypt logs and lineage information
- Audit access to observability dashboards
Performance & Maintenance
- Use sampling for large datasets
- Automate expectation updates with version control
Compliance Alignment
- Store historical lineage for traceability
- Automate compliance checks during deployment
Automation Ideas
- Auto-trigger schema validation on PRs
- Use observability gates in CD workflows
8. Comparison with Alternatives
| Tool / Approach | Data Observability | Data Catalogs | Data Quality Frameworks |
|---|---|---|---|
| Primary Focus | Health & anomalies | Metadata | Rule-based validation |
| Examples | Monte Carlo, Acceldata | Collibra, Alation | Great Expectations |
| DevSecOps Role | CI/CD blocker, alerting | Planning stage | Pre-deployment checks |
| Best Use | Real-time, scalable | Governance | Test-based validation |
Choose Data Observability when:
- You need real-time detection
- Your data pipelines are complex or mission-critical
- You are running regulated or audited workloads
9. Conclusion
Data Observability is a cornerstone of modern DevSecOps practices where data reliability, integrity, and security must be integrated into every stage of the lifecycle. By embedding observability into pipelines, teams can proactively manage risks, ensure compliance, and prevent silent data failures from impacting production systems.
Future Trends
- AI-powered anomaly detection
- Deeper CI/CD integration
- Standardization via OpenLineage and DataOps standards