Introduction & Overview
Data Observability is a critical practice in modern data management, ensuring that data pipelines and systems deliver reliable, accurate, and timely data to support business decisions. In the context of DataOps—a methodology that applies DevOps principles to data management—Data Observability acts as the foundation for monitoring, managing, and optimizing data workflows. This tutorial provides a comprehensive guide to understanding and implementing Data Observability within a DataOps framework, covering its concepts, architecture, setup, use cases, benefits, limitations, and best practices.
This 5–6 page tutorial is designed for technical readers, including data engineers, DataOps practitioners, and analysts, who seek to integrate Data Observability into their workflows. By the end, you’ll have a clear understanding of how to leverage Data Observability to enhance data quality, reduce downtime, and align with DataOps principles.
What is Data Observability?
Definition
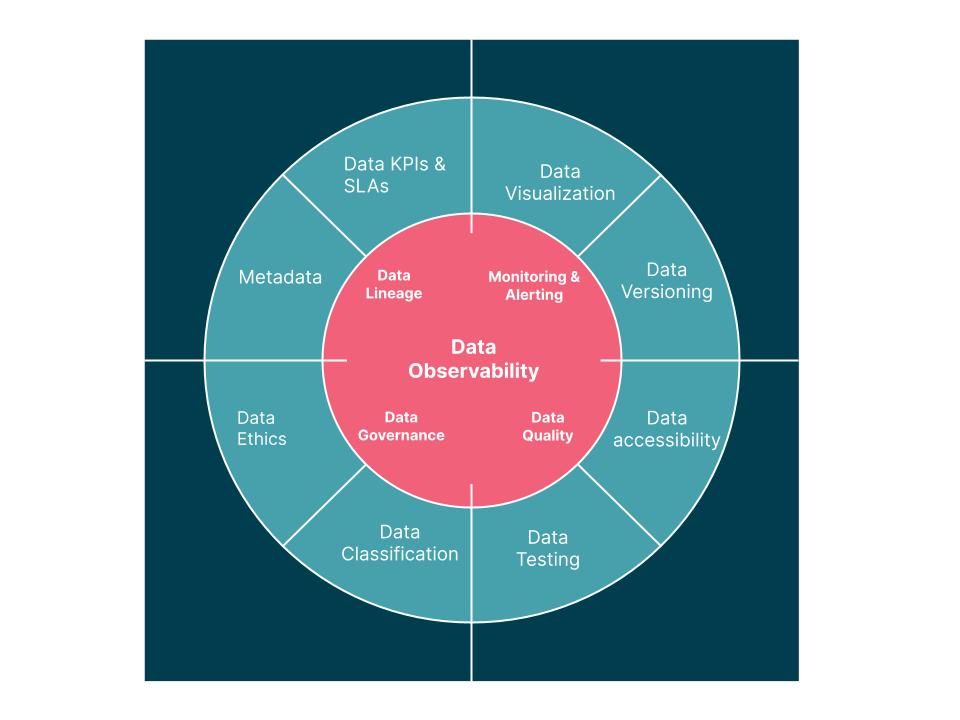
Data Observability refers to the ability to monitor, understand, and manage the health, quality, and performance of data across its entire lifecycle within an organization’s data systems. Unlike traditional monitoring, which focuses on predefined metrics, Data Observability emphasizes proactive insight into data pipelines by analyzing logs, metrics, traces, and metadata to detect anomalies, ensure compliance, and maintain trust in data.
History or Background
The concept of observability originated in control systems theory, as defined by Rudolf E. Kálmán in 1960, describing how well a system’s internal state can be inferred from its outputs. In IT, observability evolved from monitoring and logging practices in DevOps to address the complexity of distributed systems. Data Observability emerged as a specialized application of these principles to data systems, driven by the growing complexity of data pipelines, cloud-based data platforms, and the need for real-time analytics. By 2018, it gained traction as organizations recognized the need to manage sprawling data landscapes in DataOps environments.
- Pre-2015: Data engineers relied on manual scripts, cron jobs, and monitoring dashboards.
- 2016–2019: Rise of modern data platforms (Snowflake, BigQuery, Databricks) created the need for automated quality checks.
- 2020 onwards: Data Observability tools (Monte Carlo, Acceldata, Bigeye, etc.) emerged to bring DevOps-style monitoring + alerting into DataOps.
Why is it Relevant in DataOps?
DataOps combines agile methodologies, automation, and collaboration to streamline data pipelines and deliver high-quality analytics. Data Observability is integral to DataOps because it:
- Ensures Data Quality: Detects anomalies like duplicates or missing data that could undermine analytics.
- Reduces Data Downtime: Identifies and resolves issues before they impact business decisions.
- Enhances Collaboration: Provides a shared understanding of data health across teams.
- Supports Automation: Integrates with CI/CD pipelines to enable continuous testing and monitoring.
Without Data Observability, DataOps teams risk operating on unreliable data, leading to costly errors and eroded trust in analytics.
Core Concepts & Terminology
Key Terms and Definitions
- Data Quality: Measures of data accuracy, completeness, consistency, and timeliness.
- Data Lineage: Tracks the origin, transformations, and movement of data through pipelines.
- Data Freshness: Indicates how up-to-date data is, critical for real-time analytics.
- Data Volume: Monitors the amount of data flowing through pipelines to detect drops or spikes.
- Schema Observability: Tracks changes in data structure to prevent pipeline failures.
- Anomaly Detection: Identifies unexpected patterns in data using statistical or machine learning methods.
- Metadata: Contextual information about data, such as timestamps or sources, used for observability.
| Term | Definition |
|---|---|
| Freshness | How recent and up-to-date the data is. |
| Completeness | Ensures all expected records/fields are present. |
| Accuracy | Data values correctly represent real-world facts. |
| Lineage | The complete journey of data from source to consumption. |
| Anomaly Detection | Identifying unusual patterns in datasets. |
| Data Drift | Gradual changes in data distribution over time. |
How It Fits into the DataOps Lifecycle
The DataOps lifecycle consists of three stages: Detection, Awareness, and Iteration. Data Observability supports each stage:
- Detection: Identifies issues like schema changes or anomalies through continuous monitoring.
- Awareness: Provides insights into data health via dashboards, alerts, and lineage tracking.
- Iteration: Enables teams to refine pipelines by analyzing observability data and implementing fixes.
Data Observability acts as a feedback loop, ensuring that data pipelines are continuously improved and aligned with business needs.
Architecture & How It Works
Components
Data Observability systems typically include:
- Monitoring Agents: Collect metrics, logs, and traces from data pipelines.
- Anomaly Detection Engine: Uses statistical models or machine learning to identify deviations.
- Lineage Tracker: Maps data flow across sources, transformations, and destinations.
- Alerting System: Notifies teams of issues via email, Slack, or other platforms.
- Visualization Dashboard: Displays data health metrics and lineage in a user-friendly interface.
Internal Workflow
- Data Collection: Agents gather metrics (e.g., volume, freshness), logs, and traces from data sources and pipelines.
- Analysis: The anomaly detection engine processes data to identify issues, using context-aware algorithms to distinguish normal from abnormal behavior.
- Alerting: Issues trigger alerts based on predefined thresholds or machine learning models.
- Root Cause Analysis: Lineage and metadata help trace issues to their source.
- Visualization: Dashboards display real-time insights, enabling quick action.
Architecture Diagram Description
Imagine a layered architecture:
- Bottom Layer (Data Sources): Databases, data lakes, or streaming platforms (e.g., Snowflake, Apache Kafka).
- Middle Layer (Observability Platform): Tools like Monte Carlo or Datagaps process data, detect anomalies, and track lineage.
- Top Layer (User Interface): Dashboards and alerting systems provide insights and notifications.
Arrows connect sources to the observability platform, which feeds into CI/CD pipelines and visualization tools, forming a feedback loop.
        +---------------------+
        |   Data Sources      |
        | (DB, APIs, Streams) |
        +----------+----------+
                   |
                   v
        +----------+----------+
        |   Data Observability|
        |     Collectors       |
        +----------+----------+
                   |
        +----------+----------+
        | Metrics & Anomaly   |
        | Detection Engine    |
        +----------+----------+
                   |
        +----------+----------+
        | Alerts & Dashboards |
        |  (Slack, Grafana)   |
        +----------+----------+
                   |
        +----------+----------+
        | CI/CD & Orchestration|
        | (Airflow, dbt, etc.) |
        +----------------------+
Integration Points with CI/CD or Cloud Tools
- CI/CD: Integrates with tools like Jenkins or GitHub Actions to run data quality tests during pipeline updates.
- Cloud Tools: Connects with AWS Glue, Google Cloud Dataflow, or Azure Data Factory for real-time monitoring.
- Orchestration: Works with Apache Airflow or Orchestra to monitor pipeline performance.
Installation & Getting Started
Basic Setup or Prerequisites
To implement Data Observability, you need:
- Data Pipeline: A working pipeline (e.g., Apache Airflow, dbt).
- Observability Tool: Choose a tool like Monte Carlo, Bigeye, or DataKitchen’s open-source DataOps Observability.
- Environment: Python 3.12+, Docker, and Kubernetes (for tools like DataKitchen).
- Access: Permissions to access data sources and configure integrations.
- Virtual Environment: Recommended for Python-based setups.
Hands-on: Step-by-Step Beginner-Friendly Setup Guide
This guide demonstrates setting up DataKitchen’s open-source DataOps Observability tool on a local Kubernetes cluster using Minikube.
- Install Prerequisites:
- Install Python 3.12:
sudo apt-get install python3.12(Ubuntu) or equivalent. - Install Minikube:
curl -LO https://storage.googleapis.com/minikube/releases/latest/minikube-linux-amd64 && sudo install minikube-linux-amd64 /usr/local/bin/minikube. - Install Docker: Follow Docker’s official installation guide.
.md - Install Helm:
curl https://raw.githubusercontent.com/helm/helm/main/scripts/get-helm-3 | bash.
- Install Python 3.12:
- Set Up Virtual Environment:
python3.12 -m venv venv
source venv/bin/activate
pip install --upgrade pip
3. Clone DataKitchen Repository:
git clone https://github.com/DataKitchen/dataops-observability.git
cd dataops-observability
4. Install Dependencies:
pip install --editable '.[dev]'
pip install pytest-xdist pre-commit
pre-commit install
5. Deploy to Minikube:
minikube start
invoke deploy.local
6. Verify Services:
minikube service listAccess the observability dashboard via the provided URL.
7. Run Tests:
invoke test.all --processes=2 --level=INFO8. Clean Up:
invoke deploy.nuke
minikube stop
For detailed documentation, refer to DataKitchen’s GitHub repository.
Real-World Use Cases
- Retail: Inventory Management
- Scenario: A retailer uses real-time sales data to adjust inventory. A pipeline glitch causes delayed data updates, leading to overstocking.
- Solution: Data Observability monitors freshness and volume, alerting teams to delays. Lineage tracking identifies a faulty ETL process, enabling quick fixes.
- Outcome: Reduced overstock costs and improved inventory accuracy.
- Finance: Fraud Detection
- Scenario: A bank’s fraud detection system relies on transaction data. An anomaly in data distribution skews risk scores.
- Solution: Observability tools detect the anomaly using statistical models and trace it to a schema change in the source database.
- Outcome: Faster resolution of data issues, ensuring reliable fraud detection.
- Healthcare: Patient Data Compliance
- E-commerce: Customer Analytics
- Scenario: An e-commerce platform analyzes customer behavior. A data quality issue duplicates clickstream data, skewing metrics.
- Solution: Observability detects duplicates via anomaly detection and provides a Data Quality Scorecard for actionable insights.
- Outcome: Improved analytics accuracy and better marketing decisions.
Benefits & Limitations
Key Advantages
- Proactive Issue Detection: Identifies anomalies before they impact decisions.
- Improved Collaboration: Shared visibility into data health fosters teamwork.
- Compliance Support: Ensures adherence to regulations like GDPR and CCPA.
- Automation: Reduces manual troubleshooting with automated alerts and remediation.
Common Challenges or Limitations
- Complexity: Setting up observability for complex pipelines requires significant configuration.
- Cost: Advanced tools like Monte Carlo can be expensive for small teams.
- Learning Curve: Teams need training to interpret observability data effectively.
- False Positives: Anomaly detection may flag normal variations, requiring fine-tuning.
Best Practices & Recommendations
Security Tips
- Restrict Access: Use role-based access control for observability dashboards.
- Encrypt Data: Ensure observability data is encrypted in transit and at rest.
- Audit Logs: Regularly audit observability logs for unauthorized access.
Performance
- Optimize Queries: Use efficient queries to minimize observability overhead.
- Scale Infrastructure: Deploy observability tools on scalable cloud platforms like AWS or GCP.
- Tune Alerts: Set context-aware thresholds to reduce false positives.
Maintenance
- Regular Updates: Keep observability tools updated to leverage new features.
- Monitor Metadata: Continuously track metadata to maintain lineage accuracy.
- Automate Testing: Integrate automated data quality tests into CI/CD pipelines.
Compliance Alignment
- Align observability with GDPR, CCPA, or HIPAA by tracking data lineage and ensuring auditability.
- Use tools like Apache Atlas for compliance-focused lineage tracking.
Automation Ideas
- Automate anomaly remediation using tools like Datafold or AWS Lambda.
- Integrate observability with orchestration tools like Apache Airflow for automated pipeline monitoring.
Comparison with Alternatives
| Feature | Data Observability | Traditional Monitoring | Data Quality Tools |
|---|---|---|---|
| Focus | Holistic data health, lineage, and anomalies | Predefined metrics and logs | Rule-based data validation |
| Proactivity | Detects unknown issues via ML | Limited to known issues | Limited to predefined rules |
| Lineage Tracking | Comprehensive | Limited or none | Partial |
| Integration | CI/CD, cloud, orchestration | Basic integrations | Moderate integrations |
| Use Case | End-to-end pipeline health | System uptime | Data validation |
When to Choose Data Observability
- Choose Data Observability when managing complex, distributed data pipelines requiring real-time insights and lineage tracking.
- Choose Alternatives for simple pipelines with known issues (traditional monitoring) or specific validation needs (data quality tools).
Conclusion
Data Observability is a cornerstone of DataOps, enabling teams to ensure data reliability, reduce downtime, and foster collaboration. By monitoring data quality, lineage, and performance, it empowers organizations to make data-driven decisions with confidence. As data ecosystems grow more complex, Data Observability will evolve to incorporate AI-driven insights and deeper integration with cloud platforms.
Future Trends
- Stronger AI-powered predictive data quality management.
- Automated root cause analysis and resolution.
- Enhanced support for multi-cloud and hybrid environments.
- Growing convergence with data governance and privacy tools.
Next Steps
- Explore leading data observability platforms and open-source tools.
- Begin with small pilots instrumenting critical data pipelines.
- Incorporate observability metrics into DataOps CI/CD pipelines.
- Join data observability communities and forums to stay informed.