Introduction & Overview
Data lineage visualization is a critical component in modern DataOps practices, enabling organizations to track, manage, and understand the flow of data across complex systems. This tutorial provides an in-depth exploration of data lineage visualization, its role in DataOps, and practical guidance for implementation.
What is Data Lineage Visualization?
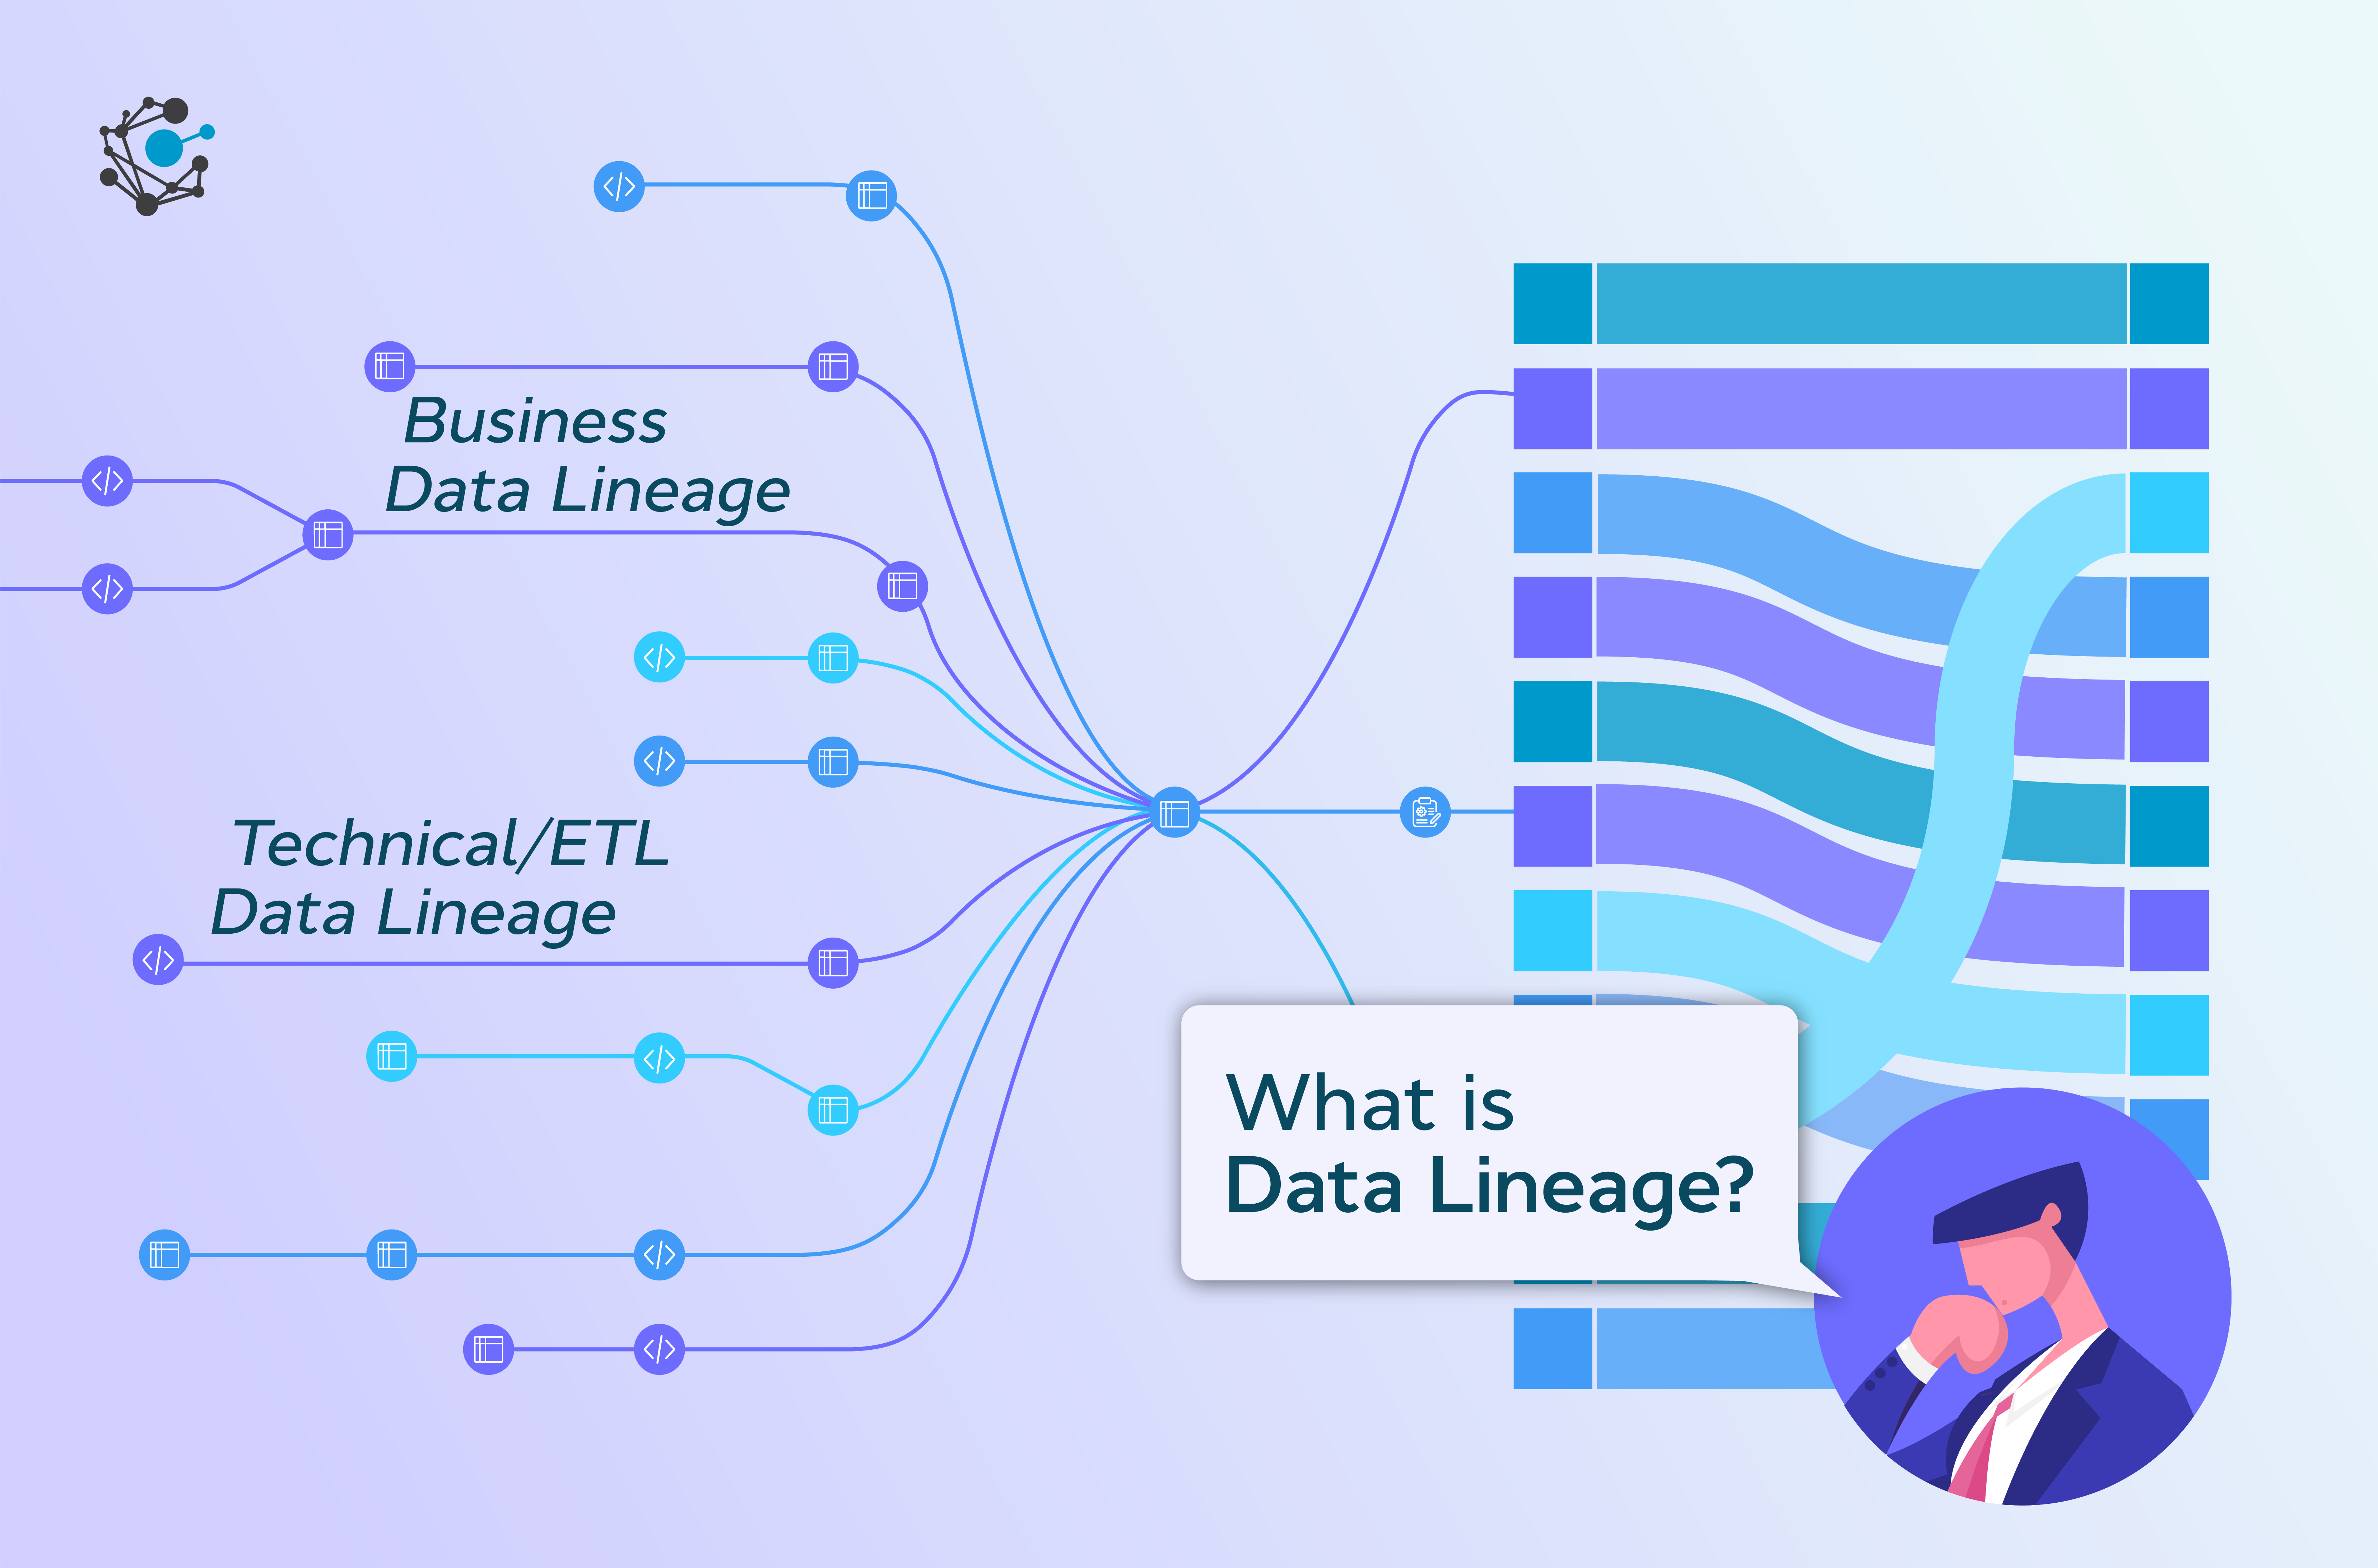
Data lineage visualization refers to the graphical representation of data’s journey through various processes, transformations, and systems within an organization. It maps the origin, movement, and transformation of data, providing a clear view of dependencies and impacts.
- Purpose: To enhance transparency, traceability, and trust in data pipelines.
- Key Features: Visual graphs, metadata tracking, dependency mapping, and impact analysis.
History or Background
Data lineage concepts emerged with the rise of data warehousing and ETL (Extract, Transform, Load) processes in the 1990s. As data ecosystems grew more complex with big data, cloud computing, and DataOps methodologies, visualization tools became essential for managing intricate data pipelines.
- Evolution: From manual documentation to automated, graph-based visualizations.
- Key Milestones:
- Early 2000s: Basic lineage tracking in ETL tools like Informatica.
- 2010s: Integration with big data platforms like Hadoop and Spark.
- 2020s: Advanced visualizations with AI-driven insights and cloud-native tools.
Why is it Relevant in DataOps?
DataOps emphasizes collaboration, automation, and agility in data management. Data lineage visualization aligns with these principles by:
- Improving Collaboration: Providing a shared view of data flows for data engineers, analysts, and stakeholders.
- Enhancing Automation: Enabling automated tracking of data transformations.
- Ensuring Compliance: Supporting regulatory requirements like GDPR, CCPA, and HIPAA by tracing data origins and usage.
- Reducing Errors: Identifying bottlenecks, errors, or inconsistencies in pipelines.
Core Concepts & Terminology
Key Terms and Definitions
- Data Lineage: The lifecycle of data, showing its origins, transformations, and destinations.
- Metadata: Information about data, such as schema, source, and transformation rules.
- Lineage Graph: A directed graph where nodes represent data assets (e.g., tables, files) and edges represent transformations or dependencies.
- Impact Analysis: Identifying downstream effects of changes to a data asset.
- Dependency Mapping: Tracking upstream dependencies for a given data asset.
| Term | Definition |
|---|---|
| Lineage | End-to-end mapping of data flow (source → transformations → target). |
| Upstream/Downstream | Data producers (upstream) and consumers (downstream). |
| Impact Analysis | Assessing effects of schema or pipeline changes. |
| Metadata | Data about data, used to build lineage maps. |
| Active Lineage | Real-time lineage updates as pipelines run. |
| Passive Lineage | Static lineage captured from documentation or query logs. |
How It Fits into the DataOps Lifecycle
DataOps involves stages like data ingestion, processing, analysis, and delivery. Data lineage visualization supports:
- Ingestion: Tracks data sources and their entry points.
- Processing: Maps transformations, ensuring accuracy and reproducibility.
- Analysis: Provides context for data reliability in reporting or analytics.
- Delivery: Ensures data integrity for downstream consumers.
Architecture & How It Works
Components & Internal Workflow
Data lineage visualization systems typically include:
- Metadata Repository: Stores metadata about data assets and transformations.
- Lineage Collector: Gathers lineage information from ETL tools, databases, or pipelines.
- Visualization Engine: Renders lineage graphs using frameworks like D3.js or Graphviz.
- Query Interface: Allows users to explore lineage or perform impact analysis.
Workflow:
- Metadata Extraction: Collect metadata from data sources (e.g., SQL queries, ETL jobs).
- Lineage Mapping: Build a graph of data flows using extracted metadata.
- Visualization: Render the graph in a user-friendly interface.
- Interaction: Enable users to query, zoom, or analyze the lineage graph.
Architecture Diagram (Description)
The architecture consists of:
- Data Sources: Databases, data lakes, or APIs feeding raw data.
- ETL/ELT Pipelines: Tools like Apache Airflow or dbt for data transformation.
- Metadata Layer: A centralized store (e.g., Apache Atlas, Amundsen) for lineage data.
- Visualization Layer: A web-based UI rendering the lineage graph.
- Integration Layer: Connects to CI/CD tools or cloud platforms.
Diagram (Text-Based):
[Data Sources] --> [ETL/ELT Pipelines] --> [Metadata Repository]
                                                    |
                                               [Visualization Engine]
                                                    |
                                                [Web UI]
          +--------------------+
          |   Data Sources     |
          | (DBs, APIs, Files) |
          +--------------------+
                    |
                    v
        +----------------------+
        | Metadata Collectors  |
        +----------------------+
                    |
                    v
        +----------------------+
        |  Lineage Processor   |
        +----------------------+
                    |
                    v
        +----------------------+
        |  Metadata Catalog    |
        +----------------------+
                    |
                    v
        +----------------------+
        | Visualization Layer  |
        | (Graph/Dashboard)    |
        +----------------------+
Integration Points with CI/CD or Cloud Tools
- CI/CD Integration: Lineage tools can integrate with Jenkins or GitHub Actions to track changes in pipeline code.
- Cloud Tools: Compatible with AWS Glue, Google Data Catalog, or Azure Data Factory for cloud-native lineage tracking.
- APIs: REST APIs for integrating lineage data into custom dashboards or monitoring tools.
Installation & Getting Started
Basic Setup or Prerequisites
To set up a data lineage visualization tool like Apache Atlas:
- Hardware: 8GB RAM, 4-core CPU, 50GB storage.
- Software:
- Java 8 or later.
- Apache Hadoop (for Atlas integration).
- A database (e.g., HBase, Solr) for metadata storage.
- Dependencies: Maven for building Atlas, Docker for containerized deployment.
Hands-on: Step-by-Step Beginner-Friendly Setup Guide
This guide sets up Apache Atlas for data lineage visualization.
- Install Prerequisites:
sudo apt update
sudo apt install openjdk-8-jdk maven
2. Download Apache Atlas:
wget https://downloads.apache.org/atlas/2.3.0/apache-atlas-2.3.0-bin.tar.gz
tar -xvzf apache-atlas-2.3.0-bin.tar.gz
cd apache-atlas-2.3.0
3. Configure Atlas:
Edit conf/atlas-application.properties to set up the metadata store:
atlas.graph.storage.backend=hbase
atlas.graph.index.backend=solr
4. Start Atlas:
./bin/atlas_start.py5. Access Web UI:
Open http://localhost:21000 in a browser to view the lineage interface.
6. Ingest Metadata:
Use Atlas REST API to import metadata:
curl -X POST -u admin:admin -H "Content-Type: application/json" \
-d '{"entity": {"typeName": "Table", "attributes": {"name": "sales_data"}}}' \
http://localhost:21000/api/atlas/v2/entity
7. Visualize Lineage:
Navigate to the Atlas UI, search for “sales_data,” and view its lineage graph.
Real-World Use Cases
Scenario 1: Financial Data Compliance
A bank uses data lineage visualization to comply with Basel III regulations.
- Problem: Need to trace data from transaction systems to regulatory reports.
- Solution: Apache Atlas tracks data from source databases through ETL pipelines to final reports, ensuring auditability.
- Outcome: Reduced audit preparation time by 40%.
Scenario 2: E-commerce Data Pipeline Debugging
An e-commerce company uses lineage visualization to troubleshoot a faulty recommendation engine.
- Problem: Incorrect product recommendations due to data inconsistencies.
- Solution: Lineage graphs identify a misconfigured ETL job, enabling quick fixes.
- Outcome: Improved recommendation accuracy by 25%.
Scenario 3: Healthcare Data Governance
A hospital tracks patient data flows to ensure HIPAA compliance.
- Problem: Ensuring sensitive data is not exposed in analytics pipelines.
- Solution: Lineage tools highlight unauthorized data access points.
- Outcome: Enhanced data security and compliance.
Industry-Specific Example: Retail
Retailers use lineage visualization to optimize inventory management by tracking data from supply chain systems to sales dashboards, identifying delays or errors in real-time.
Benefits & Limitations
Key Advantages
- Transparency: Clear view of data flows enhances trust and collaboration.
- Compliance: Simplifies audits for regulations like GDPR or CCPA.
- Error Detection: Identifies pipeline issues quickly.
- Scalability: Supports complex, multi-system data environments.
Common Challenges or Limitations
- Complexity: Setting up lineage tools can be resource-intensive.
- Metadata Overload: Large datasets may overwhelm visualization tools.
- Integration Gaps: Some tools lack support for legacy systems.
- Maintenance: Requires ongoing updates to reflect pipeline changes.
Best Practices & Recommendations
Security Tips
- Restrict access to lineage metadata using role-based access control (RBAC).
- Encrypt sensitive metadata in transit and at rest.
Performance
- Optimize metadata storage with indexing (e.g., Solr for Atlas).
- Use incremental metadata updates to reduce processing overhead.
Maintenance
- Regularly audit lineage data for accuracy.
- Automate metadata ingestion using APIs or scripts.
Compliance Alignment
- Map lineage to regulatory requirements (e.g., GDPR’s data provenance).
- Document lineage processes for audit trails.
Automation Ideas
- Integrate lineage tools with CI/CD pipelines for automatic updates.
- Use scheduling tools like Apache Airflow to refresh lineage graphs.
Comparison with Alternatives
| Feature/Tool | Apache Atlas | Collibra | Informatica EDC | Open Source Alternatives |
|---|---|---|---|---|
| Visualization | Graph-based | Advanced | Graph-based | Varies (e.g., Amundsen) |
| Cloud Integration | Moderate | Strong | Strong | Limited |
| Ease of Setup | Complex | Moderate | Complex | Varies |
| Cost | Free | Paid | Paid | Free |
| Community Support | Strong | Limited | Moderate | Varies |
When to Choose Data Lineage Visualization
- Choose Atlas: For open-source, customizable solutions in complex Hadoop ecosystems.
- Choose Collibra/Informatica: For enterprise-grade, cloud-native integrations.
- Avoid Visualization: When dealing with simple, small-scale pipelines with minimal transformation needs.
Conclusion
Data lineage visualization is a cornerstone of DataOps, providing clarity, compliance, and efficiency in data management. As organizations scale their data operations, adopting robust lineage tools will be critical for maintaining trust and agility.
Future Trends
- AI-Driven Lineage: Automated detection of lineage patterns using machine learning.
- Real-Time Visualization: Dynamic updates for streaming data pipelines.
- Cloud-Native Tools: Increased adoption of tools like AWS Glue Data Catalog.
Next Steps
- Explore Apache Atlas or Collibra for hands-on experience.
- Join communities like the Apache Atlas mailing list or DataOps forums.
- Official Resources:
- Apache Atlas Documentation
- Collibra Community
- Informatica EDC