Introduction & Overview
What is Logging?
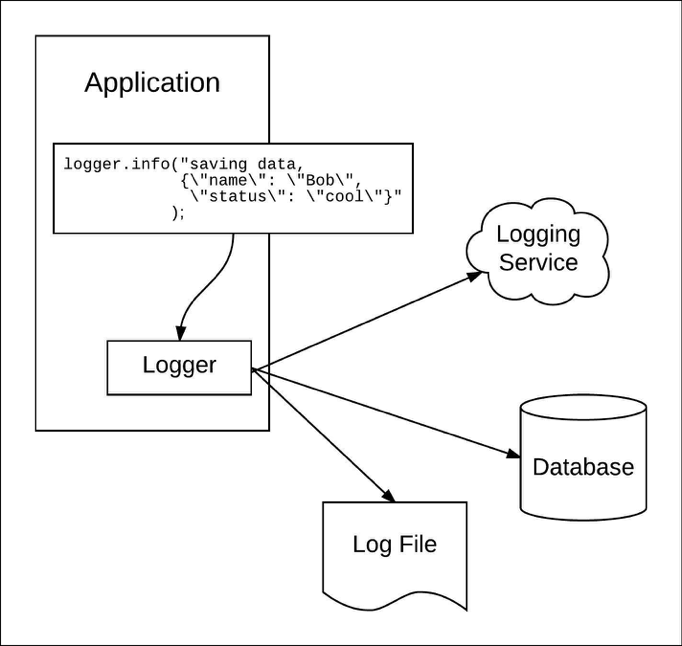
Logging in DataOps refers to the systematic recording of events, activities, and metrics generated during data processing, transformation, and movement within data pipelines. These logs capture critical information about system performance, errors, data lineage, and user interactions, enabling monitoring, debugging, and auditing of data workflows.
History or Background
Logging has evolved from simple text-based error tracking in early computing systems to sophisticated, centralized systems integrated with modern data platforms. In DataOps, logging draws from DevOps principles, emphasizing observability and automation. The rise of big data and cloud computing in the 2010s necessitated robust logging solutions to handle distributed systems, leading to tools like the ELK Stack (Elasticsearch, Logstash, Kibana), Fluentd, and cloud-native logging services such as AWS CloudWatch.
- Early IT systems (1970s–1990s): Logging was primarily limited to system administrators monitoring OS-level logs (
/var/login Unix/Linux). - Big Data era (2000s): With Hadoop, Spark, and distributed data platforms, logging became essential to trace operations across clusters.
- Modern DataOps (2015–present): Logging integrates with observability stacks (ELK, Splunk, Datadog, OpenTelemetry) to monitor highly automated, CI/CD-driven pipelines.
Why is it Relevant in DataOps?
Logging is a cornerstone of DataOps, which focuses on streamlining data workflows through collaboration, automation, and observability. It provides:
- Transparency: Tracks data lineage and pipeline execution.
- Debugging: Identifies errors in complex, distributed data systems.
- Compliance: Ensures auditability for regulatory requirements.
- Performance Monitoring: Detects bottlenecks and optimizes workflows.
Core Concepts & Terminology
Key Terms and Definitions
- Log Event: A single recorded instance of an activity (e.g., pipeline run, error).
- Log Level: Severity of the event (e.g., INFO, DEBUG, ERROR, WARN).
- Log Aggregation: Centralizing logs from multiple sources for analysis.
- Structured Logging: Logs formatted in a machine-readable format (e.g., JSON).
- Log Retention: Policy defining how long logs are stored.
| Term | Definition | Example |
|---|---|---|
| Log | Record of events in text/structured form | 2025-08-18 10:00:02 Job Started: ingestion.py |
| Log Level | Severity classification: Debug, Info, Warning, Error, Critical | INFO: Data batch uploaded |
| Log Rotation | Automatic archiving/deletion of old logs to save space | Linux logrotate |
| Structured Logging | Logs in JSON/Key-Value format for machine parsing | {"level":"ERROR","message":"DB Timeout","job":"ETL1"} |
| Distributed Logging | Aggregating logs from multiple nodes/services into a central system | ELK, Splunk, CloudWatch |
How It Fits into the DataOps Lifecycle
Logging integrates across the DataOps lifecycle:
- Data Ingestion: Logs capture source metadata and ingestion errors.
- Data Transformation: Tracks processing steps and anomalies.
- Data Delivery: Monitors output quality and delivery status.
- Orchestration: Ensures pipeline scheduling and dependencies are logged.
Architecture & How It Works
Components and Internal Workflow
A typical logging architecture in DataOps includes:
- Log Generators: Data pipelines, ETL tools, or applications producing logs.
- Log Collectors: Agents (e.g., Fluentd, Logstash) that gather logs.
- Log Storage: Centralized storage (e.g., Elasticsearch, cloud storage).
- Log Analysis Tools: Dashboards (e.g., Kibana, Grafana) for visualization and querying.
Workflow: Logs are generated at each pipeline stage, collected by agents, stored centrally, and analyzed for insights or alerts.
Architecture Diagram
Since plain text cannot include images, here’s a textual description of the logging architecture diagram:
- Left Side: Data sources (databases, APIs, ETL jobs) generating logs, represented as nodes labeled “DB,” “API,” and “ETL.”
- Middle: Log collectors (Fluentd or Logstash) shown as a funnel, aggregating logs from multiple sources.
- Right Side: Centralized storage (Elasticsearch) depicted as a database icon, connected to a visualization tool (Kibana) shown as a dashboard.
- Arrows: Directional arrows from sources to collectors, then to storage, and finally to the dashboard, illustrating the log flow.
Integration Points with CI/CD or Cloud Tools
Logging integrates with:
- CI/CD: Jenkins or GitHub Actions log pipeline execution for debugging.
- Cloud Tools: AWS CloudWatch, Azure Monitor, or Google Cloud Logging for cloud-native logging.
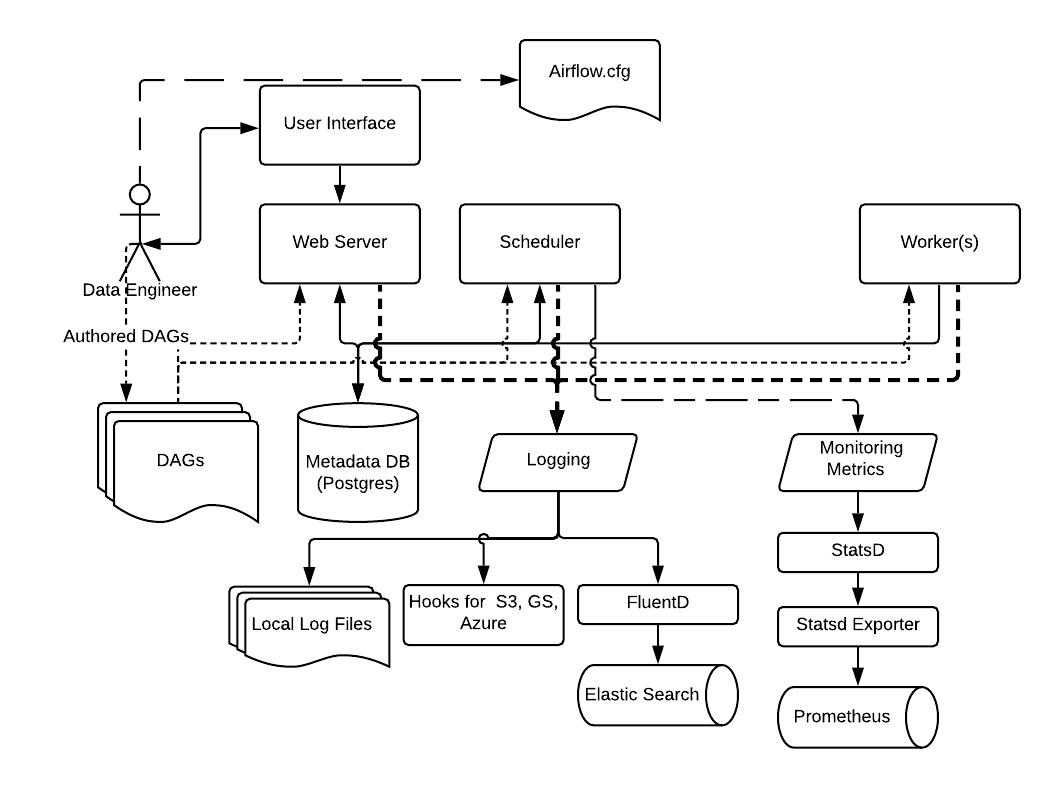
- Orchestrators: Apache Airflow or Kubernetes logs for workflow monitoring.
Installation & Getting Started
Basic Setup or Prerequisites
To set up logging with the ELK Stack (Elasticsearch, Logstash, Kibana):
- Hardware: 8GB RAM, 4-core CPU, 100GB storage (minimum).
- Software: Docker, Java 11+, ELK Stack (version 8.x recommended).
- Network: Open ports 9200 (Elasticsearch), 5601 (Kibana), 5044 (Logstash).
Hands-on: Step-by-Step Beginner-Friendly Setup Guide
- Install Docker:
   sudo apt-get update
sudo apt-get install docker.io- Pull ELK Stack Images:
   docker pull docker.elastic.co/elasticsearch/elasticsearch:8.10.0
   docker pull docker.elastic.co/logstash/logstash:8.10.0
docker pull docker.elastic.co/kibana/kibana:8.10.0- Configure Elasticsearch:
Create adocker-compose.ymlfile:
   version: '3'
   services:
     elasticsearch:
       image: docker.elastic.co/elasticsearch/elasticsearch:8.10.0
       environment:
         - discovery.type=single-node
       ports:
         - "9200:9200"
     logstash:
       image: docker.elastic.co/logstash/logstash:8.10.0
       ports:
         - "5044:5044"
     kibana:
       image: docker.elastic.co/kibana/kibana:8.10.0
       ports:
- "5601:5601"- Start Services:
docker-compose up -d- Verify Setup: Access Kibana at
http://localhost:5601in a web browser.
Real-World Use Cases
- Pipeline Monitoring: A retail company uses logging to track ETL jobs in Apache Airflow, identifying delays in inventory updates caused by data source failures.
- Anomaly Detection: A fintech firm logs data transformations to detect outliers in transaction data, flagging potential fraud by analyzing log patterns.
- Compliance Auditing: A healthcare provider uses logs to ensure HIPAA compliance by tracking data access and transformations across pipelines.
- Performance Optimization: A streaming service logs data ingestion rates to optimize real-time analytics pipelines, reducing latency in content recommendations.
Benefits & Limitations
Key Advantages
- Observability: Provides real-time insights into pipeline health and performance.
- Auditability: Supports compliance with regulations like GDPR, HIPAA, and CCPA.
- Debugging: Pinpoints errors in complex, distributed workflows.
Common Challenges or Limitations
- Volume: High log volumes can strain storage and processing resources.
- Complexity: Managing distributed logging systems requires expertise.
- Cost: Cloud logging services can become expensive at scale.
Best Practices & Recommendations
- Security Tips: Encrypt logs in transit (TLS) and at rest; restrict access with role-based access control (RBAC).
- Performance: Use structured logging (e.g., JSON) and filter unnecessary logs to reduce overhead.
- Maintenance: Set log retention policies (e.g., 30 days) to manage storage costs.
- Compliance: Align logs with regulatory standards (e.g., GDPR, CCPA) by including required metadata.
- Automation: Use tools like Logstash for automated log parsing and alerting to reduce manual effort.
Comparison with Alternatives
| Feature | ELK Stack | AWS CloudWatch | Fluentd |
|---|---|---|---|
| Open Source | Yes | No | Yes |
| Cloud-Native | Partial | Yes | Yes |
| Scalability | High | High | Medium |
| Ease of Setup | Moderate | Easy | Moderate |
| Cost | Free (self-hosted) | Pay-per-use | Free (self-hosted) |
When to Choose Logging with ELK Stack: Opt for ELK when you need an open-source, customizable logging solution with strong visualization capabilities. Use AWS CloudWatch for seamless integration with AWS services or Fluentd for lightweight, flexible log collection in diverse environments.
Conclusion
Logging is essential for DataOps, enabling observability, compliance, and optimization in data pipelines. As DataOps evolves, logging will integrate more with AI-driven analytics and real-time monitoring, enhancing predictive maintenance and automation. To get started, explore the ELK Stack for self-hosted solutions or cloud-native tools like AWS CloudWatch based on your infrastructure needs.
Next Steps:
- Experiment with popular logging stacks like ELK (Elasticsearch, Logstash, Kibana), Splunk, or cloud-native logging services.
- Explore log query languages and analytics tools for deeper insights.
- Join DataOps and logging communities to share knowledge and best practices.
Official Documentation and Communities:
- DataOps.live Docs: How to Manage Log Output
- ELK Stack Documentation (Elastic.co)
- Splunk Docs and Community Forums
- Cloud provider logging services docs (AWS CloudWatch, GCP Stackdriver, Azure Monitor)
- DevOps and DataOps discussion groups on LinkedIn and GitHub