Introduction & Overview
DataOps, short for Data Operations, is a transformative methodology that streamlines data management and analytics by integrating agile practices, DevOps principles, and automation. This tutorial provides an in-depth exploration of DataOps, designed for technical readers seeking to understand its core concepts, architecture, implementation, and real-world applications. Spanning the requested 5–6 pages, this guide covers everything from foundational principles to practical setup, use cases, benefits, limitations, and comparisons with alternative approaches.
DataOps emerged as a response to the growing complexity of managing large-scale, diverse data in modern enterprises. By fostering collaboration, automation, and continuous improvement, DataOps enables organizations to deliver high-quality, reliable data faster, aligning data processes with business goals. This tutorial aims to equip data engineers, scientists, analysts, and IT professionals with the knowledge to implement DataOps effectively.
What is DataOps?
Definition
DataOps is a set of practices, processes, and technologies that combines agile methodologies, DevOps, and lean manufacturing principles to enhance the speed, quality, and reliability of data analytics. It focuses on automating data pipelines, fostering collaboration between data teams, and ensuring data is accessible, accurate, and actionable.

History or Background
DataOps was first introduced in 2014 by Lenny Liebmann in a blog post titled “3 reasons why DataOps is essential for big data success” on IBM’s Big Data & Analytics Hub. The term gained traction through contributions from data experts like Andy Palmer of Tamr and Steph Locke. Inspired by DevOps, which revolutionized software development, DataOps adapts similar principles to address the unique challenges of data management. By 2018, Gartner recognized DataOps in its Hype Cycle for Data Management, marking its growing adoption. The methodology evolved as organizations faced increasing data volumes—forecast to reach 180 zettabytes by 2025 (IDC)—and the need for faster, more reliable analytics.
Why is it Relevant in DataOps?
DataOps is critical in modern data management because it:
- Addresses Complexity: Manages the explosion of data sources and formats in enterprises.
- Enhances Agility: Enables rapid adaptation to changing business needs through agile practices.
- Improves Quality: Ensures data accuracy and reliability via automation and governance.
- Breaks Silos: Promotes collaboration between data engineers, scientists, analysts, and business stakeholders.
- Supports Scalability: Aligns with cloud and big data technologies to handle growing data demands.
Core Concepts & Terminology
Key Terms and Definitions
- Data Pipeline: A series of processes that extract, transform, and load (ETL/ELT) data from sources to destinations for analysis.
- Data Observability: The ability to monitor and understand the health of data pipelines, including freshness, quality, and lineage.
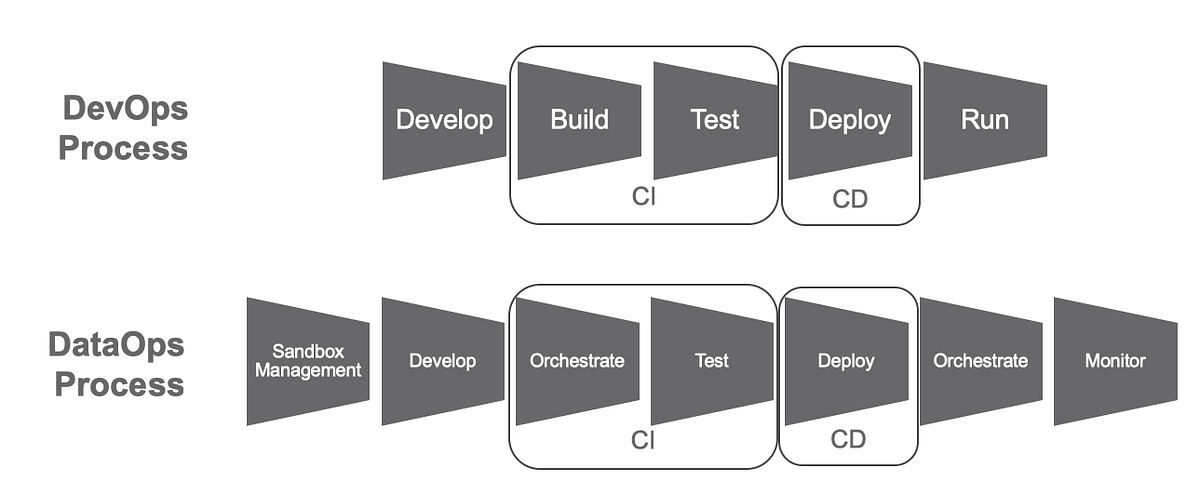
- Continuous Integration/Continuous Deployment (CI/CD): Practices borrowed from DevOps to automate testing and deployment of data pipelines.
- Data Governance: Policies and processes ensuring data quality, security, and compliance.
- Data Mesh: A decentralized architecture where data is treated as a product, owned by domain-specific teams.
- Data Fabric: A technology-driven framework that automates data integration and management across platforms.
- Agile Methodology: Iterative development approach applied to data projects for flexibility and speed.
- Lean Manufacturing: Principles focused on minimizing waste and maximizing efficiency in data workflows.
| Term | Definition |
|---|---|
| ETL / ELT | Extract, Transform, Load – foundational steps in moving data |
| Pipeline | Automated flow of data from source to consumption |
| DataOps | Operational methodology applying DevOps & Agile to data workflows |
| Data Product | A deliverable like a dashboard, report, dataset, or ML model |
| CI/CD | Continuous Integration / Continuous Deployment for data pipelines |
| Observability | Monitoring & tracking of data quality, lineage, freshness |
How it Fits into the DataOps Lifecycle
The DataOps lifecycle is a continuous feedback loop that includes:
- Planning: Define KPIs, SLAs, and data quality metrics in collaboration with stakeholders.
- Development: Build and test data pipelines using agile sprints and CI/CD practices.
- Orchestration: Automate data workflows to move data from sources to analytics platforms.
- Monitoring: Use observability tools to track pipeline performance, data quality, and anomalies.
- Delivery: Provide reliable, governed data to business users for decision-making.
DataOps integrates these phases by emphasizing automation, collaboration, and continuous improvement, ensuring data pipelines are efficient and aligned with business objectives.
Architecture & How It Works
Components
A DataOps architecture comprises:
- Data Sources: Databases, APIs, IoT devices, or external systems (structured/unstructured, on-premises/cloud).
- Data Ingestion: Tools like Apache NiFi or Airbyte for collecting and validating data.
- Data Storage: Relational databases (e.g., PostgreSQL), NoSQL databases (e.g., MongoDB), or data lakes (e.g., AWS S3).
- Data Processing: ETL/ELT tools (e.g., Apache Spark, Databricks) for transformation and analysis.
- Orchestration Tools: Workflow managers like Apache Airflow or Prefect to automate and schedule pipelines.
- Observability Tools: Solutions like Monte Carlo or IBM Databand for monitoring data quality and pipeline health.
- Governance Layer: Tools like Collibra or Alation for data cataloging, lineage, and compliance.
Internal Workflow
- Ingestion: Data is extracted from sources, validated, and cleansed.
- Transformation: Data is processed (e.g., normalized, aggregated) using ETL/ELT tools.
- Orchestration: Workflows are automated to ensure smooth data flow.
- Monitoring: Real-time checks detect anomalies, ensuring data quality.
- Delivery: Data is made available to analytics platforms or business users.
| Component | Role |
|---|---|
| Data Sources | APIs, databases, logs, files, IoT, etc. |
| Ingestion Layer | Kafka, NiFi, Airbyte for streaming or batch data |
| Transformation | dbt, Spark, Pandas – cleansing, joining, aggregating data |
| Storage | Data lake (S3, HDFS) or warehouse (Snowflake, BigQuery, Redshift) |
| Orchestration | Apache Airflow, Prefect, Dagster for automation |
| CI/CD Engine | Jenkins, GitHub Actions, GitLab CI for pipeline deployments |
| Monitoring | Great Expectations, Monte Carlo, Databand for quality and lineage |
Architecture Diagram Description
Imagine a layered diagram:
- Bottom Layer: Data Sources (databases, APIs, IoT).
- Middle Layer: Ingestion (NiFi), Storage (data lake), Processing (Spark).
- Orchestration Layer: Airflow schedules and manages workflows.
- Top Layer: Observability (Monte Carlo) and Governance (Alation) ensure quality and compliance.
- Arrows: Show data flow from sources to delivery, with feedback loops for monitoring.
            [ Data Sources ]
        ┌────┬────┬────┬────┐
        │ API     │ DB     │   Logs│ IoT    │
        └────┴────┴────┴────┘
              ↓
     [Ingestion Layer: Kafka / Airbyte]
              ↓
     [Transformation: dbt / Spark]
              ↓
     [Storage: Data Lake / Warehouse]
              ↓
     [Orchestration: Airflow / Prefect]
              ↓
     [Delivery: BI / ML / APIs]
              ↓
 [Monitoring: Great Expectations / Databand]
              ↓
   [Governance & Compliance Layer]
Integration Points with CI/CD or Cloud Tools
- CI/CD: Tools like Jenkins or GitHub Actions automate pipeline testing and deployment.
- Cloud Tools: AWS Glue, Azure Data Factory, or Google Cloud Dataflow integrate with DataOps for scalable processing.
- Containers: Docker and Kubernetes manage scalable, portable data workflows.
- Version Control: Git tracks changes in data models and pipelines.
Installation & Getting Started
Basic Setup or Prerequisites
- Hardware: A machine with at least 8GB RAM, 4-core CPU, and 50GB storage.
- Software: Docker, Python 3.8+, Git, and a cloud account (e.g., AWS, Azure).
- Tools: Apache Airflow, PostgreSQL, and Monte Carlo (or similar observability tool).
- Knowledge: Familiarity with Python, SQL, and basic cloud concepts.
Hands-on: Step-by-Step Beginner-Friendly Setup Guide
This guide sets up a basic DataOps pipeline using Apache Airflow on a local machine.
- Install Docker:
# On Ubuntu
sudo apt-get update
sudo apt-get install docker.io
sudo systemctl start docker
2. Install Apache Airflow:
# Pull Airflow Docker image
docker pull apache/airflow:2.7.2
# Initialize Airflow database
docker run -it apache/airflow:2.7.2 initdb
3. Set Up PostgreSQL:
# Pull PostgreSQL image
docker pull postgres:latest
# Run PostgreSQL container
docker run -d --name postgres -e POSTGRES_PASSWORD=example -p 5432:5432 postgres
4. Configure Airflow:
Create a docker-compose.yml file:
version: '3'
services:
  airflow:
    image: apache/airflow:2.7.2
    ports:
      - "8080:8080"
    environment:
      - AIRFLOW__CORE__EXECUTOR=LocalExecutor
      - AIRFLOW__DATABASE__SQL_ALCHEMY_CONN=postgresql+psycopg2://postgres:example@postgres:5432/airflow
    depends_on:
      - postgres
  postgres:
    image: postgres:latest
    environment:
      - POSTGRES_PASSWORD=example
5. Run Airflow:
docker-compose up -d
# Access Airflow UI at http://localhost:8080 (default login: admin/admin)
6. Create a Simple DAG:
Save this as dags/example_dag.py in your Airflow directory:
from airflow import DAG
from airflow.operators.python import PythonOperator
from datetime import datetime

def print_hello():
    print("Hello, DataOps!")

with DAG('example_dag', start_date=datetime(2025, 1, 1), schedule_interval='@daily') as dag:
    task = PythonOperator(task_id='print_hello', python_callable=print_hello)
7. Test the Pipeline:
- Enable the DAG in the Airflow UI.
- Monitor execution and logs.
Real-World Use Cases
- Streaming Analytics for Retail:
A cosmetics retailer uses DataOps to monitor real-time social media feeds for customer sentiment. Apache Kafka ingests data, Airflow orchestrates processing, and Databricks analyzes trends, enabling rapid marketing adjustments. - Data Engineering for Finance:
A bank scales ETL processes for fraud detection using DataOps. AWS Glue processes transaction data, Monte Carlo monitors quality, and Redshift stores results, ensuring compliance and accuracy. - IoT Data for Manufacturing:
A manufacturer processes IoT sensor data for predictive maintenance. DataOps integrates data from sensors via Azure Data Factory, with Kubernetes orchestrating workflows, reducing downtime by 20%. - Healthcare Data Integration:
A hospital consolidates patient data from multiple sources using DataOps. Alation catalogs data, Airbyte handles ingestion, and Snowflake stores analytics-ready data, improving patient care decisions.
Benefits & Limitations
Key Advantages
- Faster Time-to-Insight: Automates pipelines, reducing analytics cycle time.
- Improved Data Quality: Real-time monitoring and governance ensure accuracy.
- Enhanced Collaboration: Breaks silos between data teams and business units.
- Scalability: Integrates with cloud platforms for handling large data volumes.
- Cost Efficiency: Reduces manual effort and infrastructure costs.
Common Challenges or Limitations
- Skill Gaps: Requires expertise in automation, cloud, and agile methodologies.
- Integration Complexity: Combining diverse tools and data sources can be challenging.
- Cultural Resistance: Teams may resist adopting collaborative, agile practices.
- Initial Investment: Setting up automation and observability tools requires upfront costs.
| Challenge | Description |
|---|---|
| Tool Fragmentation | Too many disconnected tools |
| Cultural Adoption | Requires buy-in from data, ops, and IT teams |
| Complexity in CI/CD | Building pipelines for non-code (SQL, YAML, etc.) |
| Skill Gap | Requires knowledge of data + DevOps + governance |
Best Practices & Recommendations
- Security Tips:
- Implement encryption and access controls for data storage and pipelines.
- Use role-based access control (RBAC) in tools like Airflow.
- Performance:
- Optimize data pipelines with batch processing for high-volume data.
- Use scalable cloud storage like AWS S3 or Azure Data Lake.
- Maintenance:
- Regularly update data catalogs and lineage tracking.
- Monitor KPIs like pipeline latency and error rates.
- Compliance Alignment:
- Ensure GDPR/HIPAA compliance with governance tools like Collibra.
- Track data lineage for regulatory audits.
- Automation Ideas:
- Automate data quality checks using tools like Great Expectations.
- Use CI/CD for pipeline updates with Jenkins or GitHub Actions.
Comparison with Alternatives
| Aspect | DataOps | DevOps | MLOps |
|---|---|---|---|
| Focus | Data pipeline automation and quality | Software development and deployment | Machine learning model deployment |
| Key Users | Data engineers, scientists, analysts | Developers, IT operations | Data scientists, ML engineers |
| Core Practices | Data governance, observability, CI/CD | CI/CD, infrastructure automation | Model training, versioning, monitoring |
| Tools | Airflow, Monte Carlo, Alation | Jenkins, Docker, Kubernetes | Kubeflow, MLflow, Seldon |
| Use Case | Real-time analytics, data integration | Software release automation | ML model lifecycle management |
When to Choose DataOps
- Choose DataOps for managing complex data pipelines and ensuring data quality.
- Use DevOps for software development and MLOps for machine learning projects.
- DataOps is ideal when collaboration between data and business teams is critical.
Conclusion
DataOps is a powerful methodology that transforms data management by integrating automation, collaboration, and agile practices. It enables organizations to deliver high-quality, actionable data faster, driving data-driven decision-making. As data volumes grow and AI/ML integration becomes more prevalent, DataOps will continue to evolve, with trends like real-time analytics and data mesh gaining traction.
Next Steps:
- Explore DataOps tools like Apache Airflow and Monte Carlo.
- Join communities like the DataOps Community (dataops.live) or IBM’s DataOps Hub.
- Experiment with the setup guide provided to build your first pipeline.