Introduction
Goal: Build a Delta Live Tables (DLT) pipeline that:
- Reads raw “orders” (as streaming) and “customer” (as batch).
- Joins them via a view.
- Writes a refined Silver table.
- Aggregates into a Gold table by market segment.
What DLT gives you (why declarative matters):
- You write transformations; DLT handles orchestration, dependency graph (DAG), cluster mgmt, retries, data quality (if enabled), and error handling.
- Optionally runs continuously (streaming) or on a schedule (triggered).
- Requires the Premium (or higher) tier.
What we’ll build:
- Bronze: two inputs (orders, customers)
- Silver: a joined/cleaned table + audit column
- Gold: an aggregate by market segment
What is Delta Live Tables (DLT)?
- DLT is a declarative way to define ETL/ELT steps as tables and views.
- You declare datasets with Python decorators (
@dlt.table,@dlt.view) or SQL (CREATE LIVE TABLE,CREATE LIVE VIEW). - DLT builds the DAG, provisions a job compute cluster, runs in Triggered or Continuous mode, and stores lineage/metrics.
How to create a DLT Pipeline (prereqs + setup)
1) Create a working schema (Unity Catalog)
We’ll use dev.etl as the target schema for DLT artifacts.
-- in a SQL cell
CREATE SCHEMA IF NOT EXISTS dev.etl;
2) Prepare source data (deep clone the samples)
The transcript uses TPCH samples. We’ll deep clone them into dev.bronze as raw inputs.
-- Orders source table
CREATE TABLE IF NOT EXISTS dev.bronze.orders_raw
DEEP CLONE samples.tpch.orders;

-- Customers source table
CREATE TABLE IF NOT EXISTS dev.bronze.customer_raw
DEEP CLONE samples.tpch.customer;
Sanity-check:
SELECT * FROM dev.bronze.orders_raw   LIMIT 5;
SELECT * FROM dev.bronze.customer_raw LIMIT 5;
Streaming Tables, Materialized Views, Views in DLT
DLT has two dataset types in code:
- Table (
@dlt.table/CREATE LIVE TABLE): persisted in target schema.- If its input is streaming (e.g.,
read_streamordlt.read_stream), the resulting table behaves as a streaming table (it ingests incrementally). - If its input is batch, it behaves like a batch-built table (recomputes deterministically when refreshed).
- If its input is streaming (e.g.,
- View (
@dlt.view/CREATE LIVE VIEW): ephemeral within the pipeline; not materialized into the target schema. Great for intermediate joins/cleanup.
Create a DLT Streaming Table (Bronze: orders)
Python (recommended)
Create a new DLT Notebook (Python). Put this at the top:
import dlt
from pyspark.sql import functions as F
Now declare the streaming bronze table for orders:
@dlt.table(
    name="orders_bronze",  # optional; defaults to function name
    table_properties={"quality": "bronze"},
    comment="Orders (raw) as a streaming table"
)
def orders_bronze():
    # Delta supports streaming reads; use read_stream.table for a streaming source
    return spark.readStream.table("dev.bronze.orders_raw")
SQL (alternative)
CREATE LIVE TABLE orders_bronze
TBLPROPERTIES (quality = 'bronze')
COMMENT 'Orders (raw) as a streaming table'
AS SELECT * FROM dev.bronze.orders_raw;
In SQL, DLT understands lineage; this is still treated as streaming because the engine recognizes an upstream streaming source (Delta supports incremental reads). In Python you’re explicit via
readStream.
Create a DLT Batch Table (Bronze: customers)
Python
@dlt.table(
    name="customer_bronze",
    table_properties={"quality": "bronze"},
    comment="Customers (raw) as batch table"
)
def customer_bronze():
    return spark.read.table("dev.bronze.customer_raw")  # batch read
SQL
CREATE LIVE TABLE customer_bronze
TBLPROPERTIES (quality = 'bronze')
COMMENT 'Customers (raw) as batch table'
AS SELECT * FROM dev.bronze.customer_raw;
Create a DLT View (to join)
Python best practice: reference pipeline tables with dlt.read() (batch semantic) or dlt.read_stream() (stream semantic).
We’ll read customers as batch and orders as stream, then join.
@dlt.view(
    name="join_view",
    comment="Join customers to orders"
)
def join_view():
    df_c = dlt.read("customer_bronze")      # batch read from within pipeline
    df_o = dlt.read_stream("orders_bronze") # stream read from within pipeline

    # Join on customer key (c_custkey == o_custkey)
    return (df_o.join(
                df_c,
                on=[df_o["o_custkey"] == df_c["c_custkey"]],
                how="left"
            ))
SQL equivalent uses the
LIVE.keyword:
CREATE LIVE VIEW join_view AS
SELECT *
FROM LIVE.orders_bronze o
LEFT JOIN LIVE.customer_bronze c
  ON o.o_custkey = c.c_custkey;
The LIVE keyword (SQL) vs dlt.read* (Python)
- SQL: use
LIVE.<table_or_view_name>to reference another pipeline dataset. - Python: use
dlt.read("name")(batch) ordlt.read_stream("name")(stream).
Using LIVE in Python isn’t valid—use the dlt helpers instead.
(Silver) Build a refined table with audit column
Turn the view into a persisted Silver table and add an insert_ts audit column:
Python
@dlt.table(
    name="joined_silver",
    table_properties={"quality": "silver"},
    comment="Joined orders+customers with audit column"
)
def joined_silver():
    return (dlt.read("join_view")
            .withColumn("insert_ts", F.current_timestamp()))
SQL
CREATE LIVE TABLE joined_silver
TBLPROPERTIES (quality = 'silver')
COMMENT 'Joined orders+customers with audit column'
AS
SELECT
  j.*,
  current_timestamp() AS insert_ts
FROM LIVE.join_view j;
(Gold) Aggregate by market segment
Group by c_mktsegment and count orders.
In TPCH, the order key is
o_orderkey.
Python
@dlt.table(
    name="orders_aggregated_gold",
    table_properties={"quality": "gold"},
    comment="Orders aggregated by market segment"
)
def orders_aggregated_gold():
    return (dlt.read("joined_silver")
            .groupBy("c_mktsegment")
            .agg(F.count("o_orderkey").alias("order_count"))
            .withColumn("insert_ts", F.current_timestamp()))
SQL
CREATE LIVE TABLE orders_aggregated_gold
TBLPROPERTIES (quality = 'gold')
COMMENT 'Orders aggregated by market segment'
AS
SELECT
  c_mktsegment,
  COUNT(o_orderkey) AS order_count,
  current_timestamp() AS insert_ts
FROM LIVE.joined_silver
GROUP BY c_mktsegment;
Orchestrate the DLT Pipeline
- Workspace > New > Delta Live Tables pipeline (sometimes shown as “ETL Pipelines”).
- Name:
00_dlt_introduction(anything you like). - Product edition:
- Core: basics (tables/views/lineage).
- Pro: adds Change Data Capture (CDC).
- Advanced: adds expectations/data quality and more controls.
For this tutorial, Core is fine.
- Mode:
- Triggered: runs when started or on schedule.
- Continuous: runs like a streaming job, never-ending.
Choose Triggered for now.
- Notebook: select the DLT notebook you just created.
- Target: set Catalog =
dev, Schema =etl. - Compute: Fixed size, 1–2 workers is fine for the demo. Driver same as worker.
- Channel:
Current(Preview adds newer features; stick to Current unless you need preview features). - Click Create, then Start.
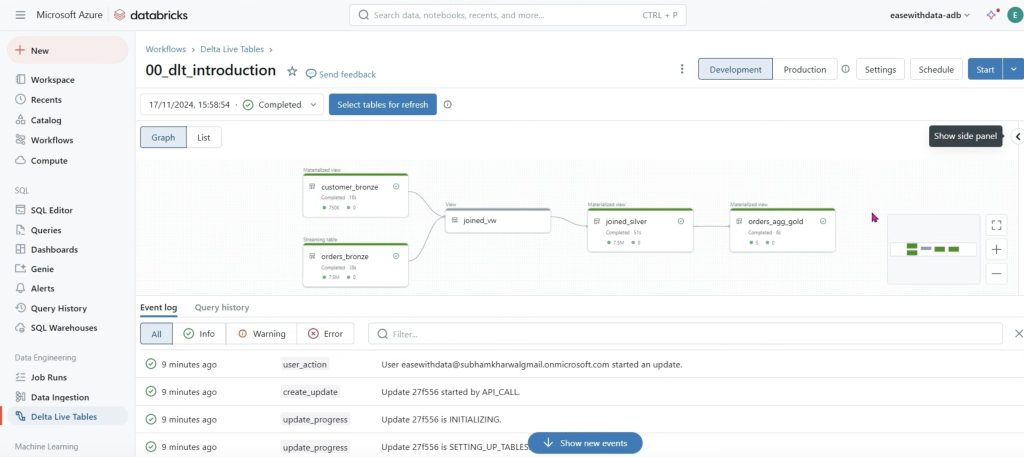
You’ll see:
- Waiting for resources → Initializing → Setting up tables → Rendering graph → Running
- A DAG graph of your pipeline, with per-dataset metrics (rows read/written).
- Event log at the bottom (great for debugging failed resolutions/imports).
Development vs Production mode
At the top of the pipeline page:
- Development (default): keeps the job cluster running after success/failure, which is handy for quick re-runs and debugging (faster iteration).
- Production: cluster is terminated when a run finishes (success or failure), reducing idle costs and behaving more like scheduled jobs.
Switch to Production when you automate/schedule.
Verifying results
In a notebook (attached to any cluster), query the outputs:
SELECT * FROM dev.etl.joined_silver       LIMIT 5;
SELECT * FROM dev.etl.orders_aggregated_gold ORDER BY order_count DESC;
You should see a handful of market segments with counts and insert_ts.
Full Python DLT notebook (copy/paste)
import dlt
from pyspark.sql import functions as F

# BRONZE: orders as streaming table
@dlt.table(
    name="orders_bronze",
    table_properties={"quality": "bronze"},
    comment="Orders (raw) as a streaming table"
)
def orders_bronze():
    return spark.readStream.table("dev.bronze.orders_raw")

# BRONZE: customers as batch table
@dlt.table(
    name="customer_bronze",
    table_properties={"quality": "bronze"},
    comment="Customers (raw) as batch table"
)
def customer_bronze():
    return spark.read.table("dev.bronze.customer_raw")

# VIEW: join within the pipeline (not materialized)
@dlt.view(
    name="join_view",
    comment="Join customers to orders"
)
def join_view():
    df_c = dlt.read("customer_bronze")        # batch semantics
    df_o = dlt.read_stream("orders_bronze")   # streaming semantics
    return (df_o.join(
                df_c,
                on=[df_o["o_custkey"] == df_c["c_custkey"]],
                how="left"
            ))

# SILVER: persisted joined table w/ audit column
@dlt.table(
    name="joined_silver",
    table_properties={"quality": "silver"},
    comment="Joined orders+customers with audit column"
)
def joined_silver():
    return dlt.read("join_view").withColumn("insert_ts", F.current_timestamp())

# GOLD: aggregated table by market segment
@dlt.table(
    name="orders_aggregated_gold",
    table_properties={"quality": "gold"},
    comment="Orders aggregated by market segment"
)
def orders_aggregated_gold():
    return (dlt.read("joined_silver")
            .groupBy("c_mktsegment")
            .agg(F.count("o_orderkey").alias("order_count"))
            .withColumn("insert_ts", F.current_timestamp()))
Example Github Repo
- https://github.com/databricks/delta-live-tables-notebooks
- https://github.com/a0x8o/delta-live-tables-hands-on-workshop