Data Anomaly Detection refers to the process of identifying data points, events, or observations that deviate significantly from the expected pattern in datasets. These anomalies often signal critical issues such as:
Security breaches
Misconfigurations
System failures
Malicious behavior
In DevSecOps, anomaly detection is used for proactive monitoring and mitigation across development, security, and operations pipelines.
History or Background
Origins in statistics: Traditional outlier detection techniques based on mean, standard deviation, and z-scores.
Adoption in cybersecurity: Became popular with the rise of intrusion detection systems (IDS).
Machine Learning Era: Modern anomaly detection leverages unsupervised and semi-supervised learning for dynamic environments.
Why is it Relevant in DevSecOps?
Proactive Threat Identification: Detects abnormal behavior in applications or infrastructure before damage occurs.
Compliance Monitoring: Flags irregularities in access logs or sensitive data handling.
Performance Optimization: Identifies system bottlenecks or failures early.
CI/CD Integrity: Ensures build and deployment data consistency.
2. Core Concepts & Terminology
Key Terms and Definitions
Term
Definition
Anomaly
A data point significantly different from others.
Baseline
The standard or expected behavior used for comparison.
False Positive
A benign event incorrectly marked as anomalous.
Time-Series Data
Data indexed in time order; common in monitoring logs.
Model Drift
Degradation in anomaly detection accuracy over time due to data changes.
Docker-Based Setup with Prometheus + Anomaly Detection
# Step 1: Clone repo
git clone https://github.com/prometheus/prometheus.git

# Step 2: Run with Docker Compose
docker-compose up -d

# Step 3: Export metrics and integrate anomaly detection script
5. Real-World Use Cases
1. CI/CD Pipeline Security
Detect unauthorized trigger of pipeline jobs.
Identify abnormal durations in build stages.
2. Cloud Cost Anomalies
Spot sudden spikes in AWS/GCP billing data.
Trigger alerts on unexpected resource provisioning.
3. Container Runtime Monitoring (Kubernetes)
Identify sudden CPU or memory spikes.
Detect suspicious pod behaviors using Falco + anomaly detection.
4. Source Code Activity
Monitor commit frequency and volume to detect insider threats or bots.
Alert on code anomalies (e.g., secret leaks using Gitleaks + anomaly check).
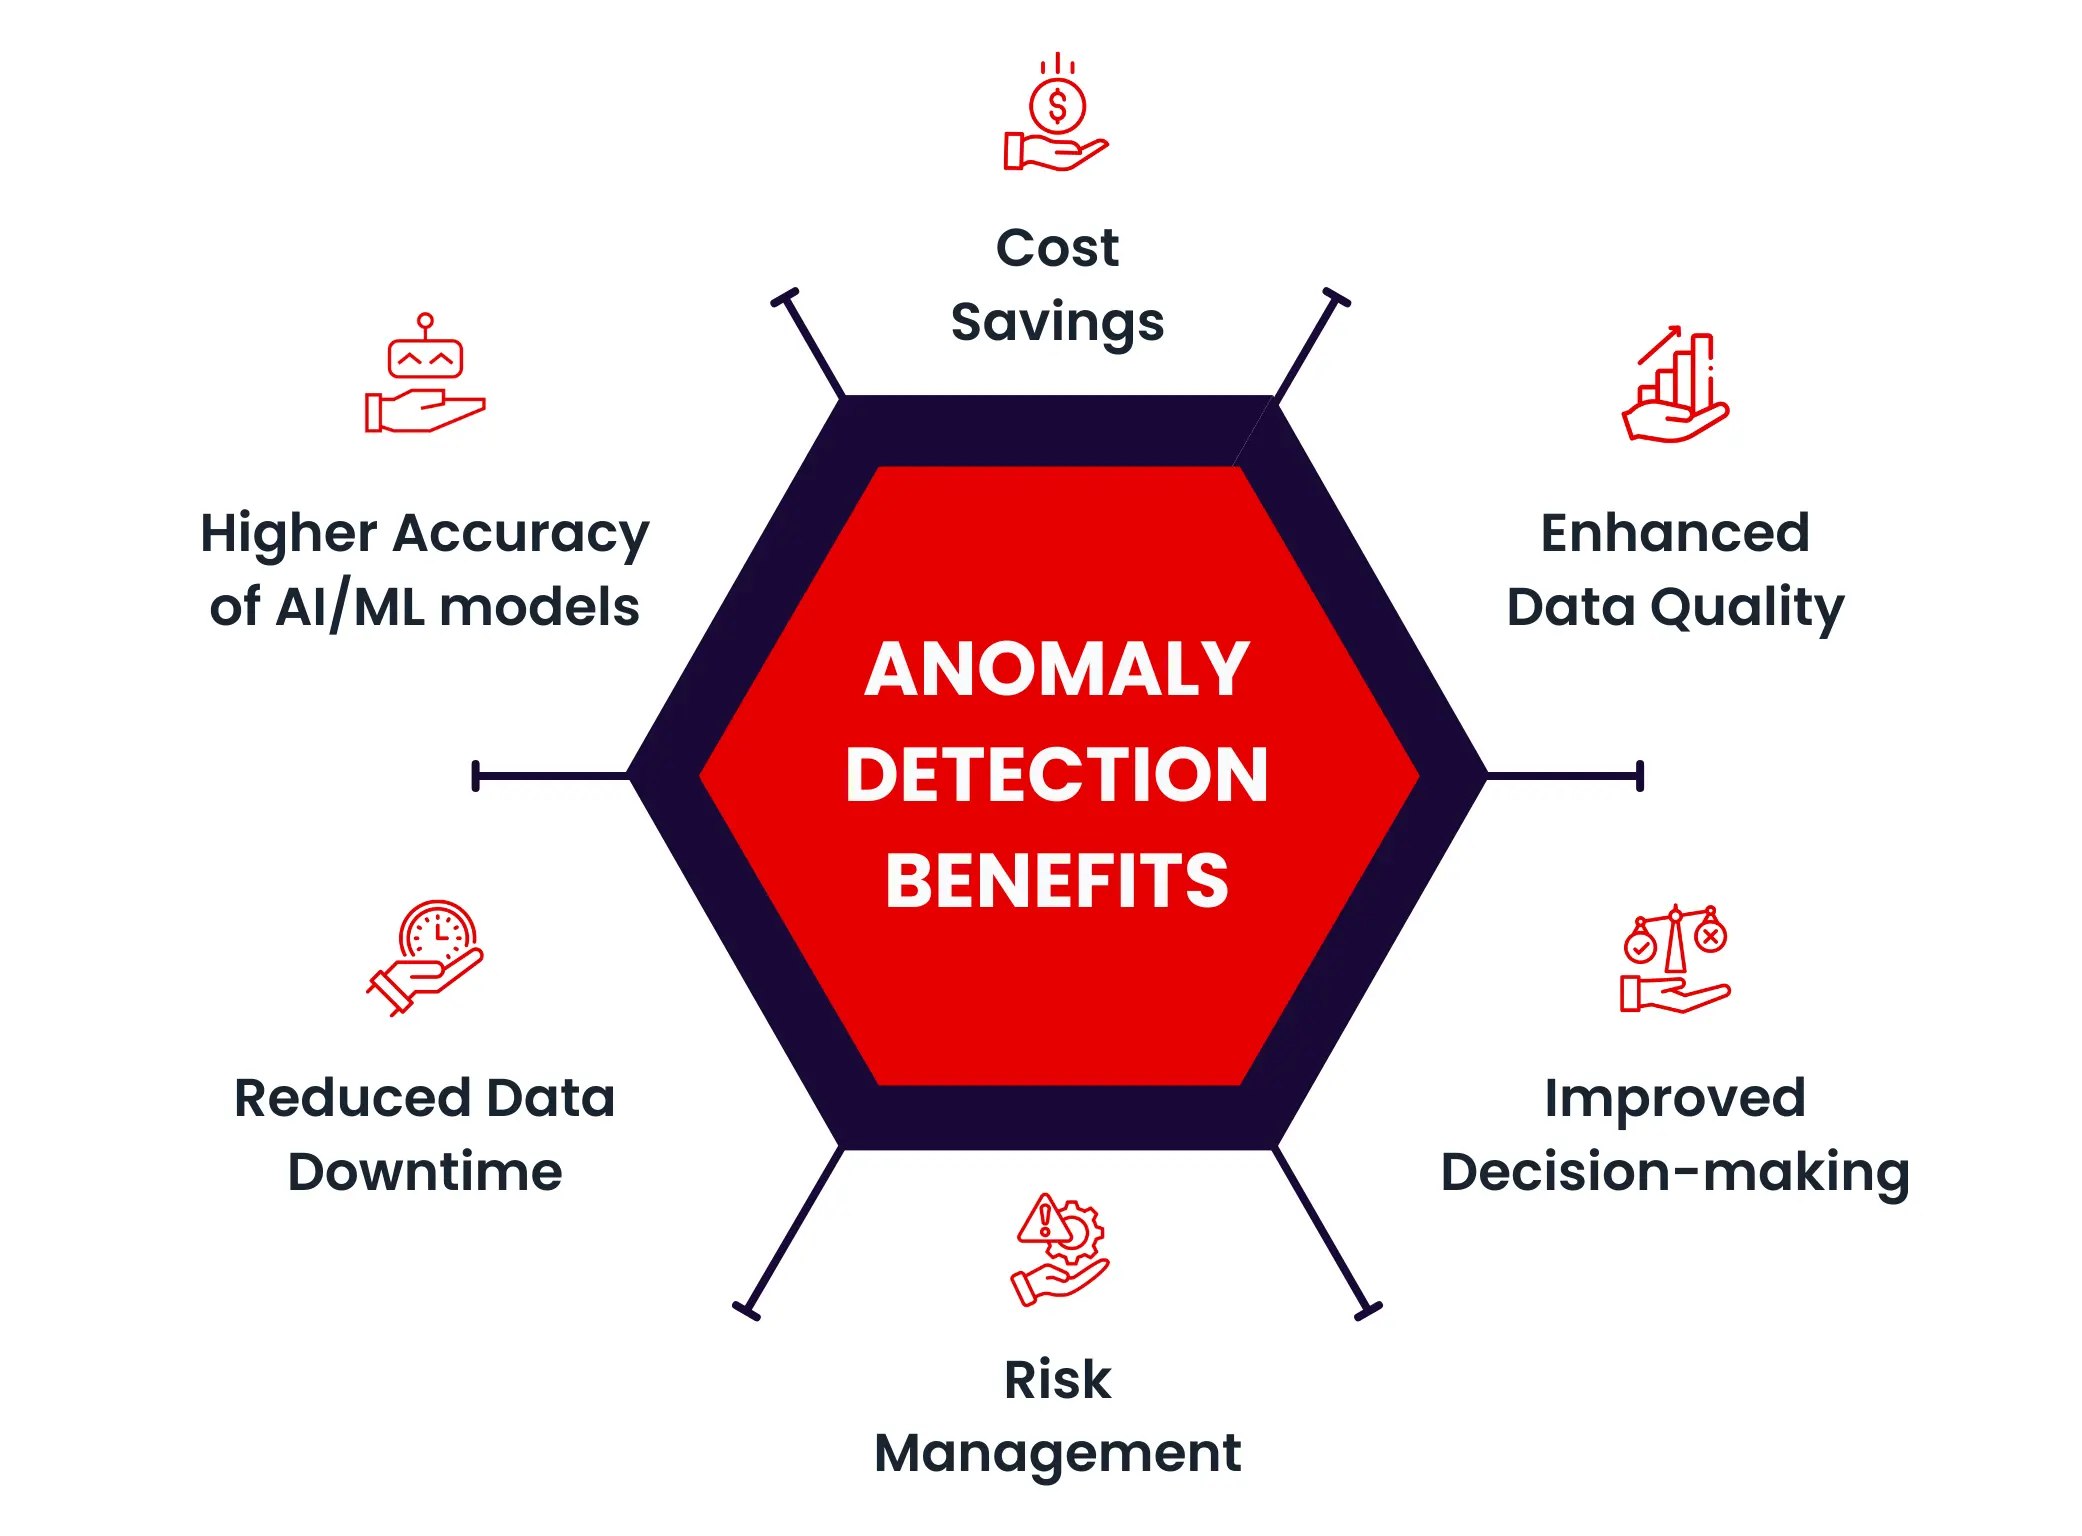
6. Benefits & Limitations
Key Advantages
Early Detection: Identify issues before escalation.
Automation-Ready: Triggers alerts and actions in real-time.
Flexible Algorithms: Choose from statistical to deep learning methods.
Cross-Domain: Applies to security, performance, reliability, and cost.
Common Limitations
Challenge
Mitigation Strategy
High False Positives
Fine-tune thresholds, feedback loops
Model Drift
Retrain models regularly
Data Volume & Velocity
Use scalable tools like Kafka, Spark
Skill Gap (ML knowledge)
Use managed services or low-code AI platforms
7. Best Practices & Recommendations
Security & Performance
Use RBAC for anomaly detection dashboards.
Encrypt data in transit and at rest.
Optimize batch size and frequency for model execution.
Compliance & Automation
Integrate with audit logs for compliance (PCI-DSS, HIPAA).
Automate remediation via SOAR tools (Security Orchestration, Automation, and Response).
Use tags to classify anomalies (e.g., “billing”, “access”, “security”).
8. Comparison with Alternatives
Tool/Method
Approach Type
Best Used For
Limitations
PyOD
ML (Python)
Customizable detection
Requires coding
Datadog Watchdog
SaaS + ML
Cloud observability
Vendor lock-in
Amazon Lookout for Metrics
Managed ML
AWS infra monitoring
AWS-only
Prometheus + Grafana + Rules
Manual thresholds
Simpler metrics
Static rules = brittle
When to Choose Data Anomaly Detection
When you’re scaling DevSecOps pipelines across teams and need real-time insights.
When traditional monitoring tools are missing hidden threats.
When you want to reduce manual triage and incident response time.
9. Conclusion
Data Anomaly Detection plays a crucial role in modern DevSecOps by improving observability, reducing response time, and enhancing system reliability. It bridges the gap between reactive monitoring and proactive intelligence.
As DevSecOps practices mature, anomaly detection will become more automated and embedded, especially with advancements in AI and telemetry. Investing in this capability is essential for secure, resilient software delivery.
Next Steps
Start with open-source libraries like PyOD or integrate anomaly detection into your Prometheus setup.
Evaluate managed services for large-scale deployment (e.g., Lookout for Metrics, Datadog).
Implement anomaly feedback loops and model retraining strategies.