Databricks is a unified cloud-based data platform designed for big data analytics, data engineering, machine learning, and artificial intelligence (AI) workloads. It’s widely used by enterprises for processing, analyzing, and visualizing large datasets.
Key Points About Databricks
- Built on Apache Spark
Databricks was founded by the creators of Apache Spark and is known for its seamless integration and managed service for Spark, making big data processing easier and faster. - Collaborative Workspace
It offers an interactive workspace where data engineers, data scientists, and analysts can work together using notebooks (in Python, Scala, SQL, or R), dashboards, and other tools. - Cloud-Native & Managed Service
Databricks runs on major cloud platforms (AWS, Azure, Google Cloud), so you don’t need to manage infrastructure or Spark clusters manually. - Delta Lake
Databricks introduced Delta Lake, an open-source storage layer that brings ACID transactions and reliability to data lakes, allowing users to build robust data pipelines. - Machine Learning & AI
It provides built-in ML tools, libraries, experiment tracking, and model deployment options. - Data Engineering & ETL
Databricks automates and simplifies ETL (Extract, Transform, Load) processes for ingesting and transforming data at scale. - SQL Analytics
Supports SQL-based analytics and interactive dashboards for business intelligence use cases. - Security & Compliance
Offers enterprise-grade security, access controls, and compliance features for sensitive data.
In Simple Words
- Databricks = Cloud-based, collaborative platform for big data and AI, built on Apache Spark.
- It helps teams process huge amounts of data, build machine learning models, and analyze everything in one place, without worrying about underlying servers.
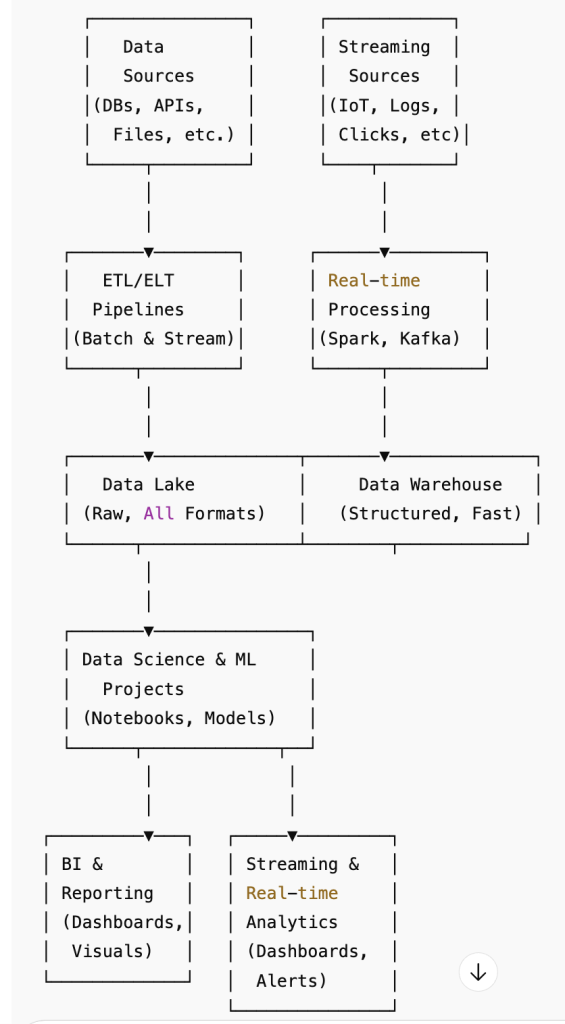
Where is Databricks Used?
- Data lakes & warehouses
- ETL pipelines
- Data science and ML projects
- Business intelligence and reporting
- Streaming and real-time analytics
Example:
Suppose a retailer wants to analyze billions of sales records to predict demand, personalize offers, and optimize inventory. Databricks allows their data engineers and data scientists to work together, process the data at scale, train ML models, and visualize results—all on one cloud-based platform.
1. Data Lakes & Data Warehouses
Data Lake
- A data lake is a large storage repository that can hold vast amounts of raw data in its native format (structured, semi-structured, unstructured), such as logs, images, JSON, CSV, or video files.
- Data is stored as-is until it is needed.
- Commonly used for big data analytics, machine learning, and data exploration.
Data Warehouse
- A data warehouse is a centralized repository designed to store structured and processed data that is ready for querying and reporting.
- Data is cleaned, transformed, and organized into tables (schema-on-write).
- Used mainly for business intelligence, reporting, and historical analysis.
2. ETL Pipelines
- ETL stands for Extract, Transform, Load.
- An ETL pipeline is a set of automated processes that:
- Extract data from various sources (databases, files, APIs)
- Transform the data (cleaning, filtering, aggregating, changing formats)
- Load the data into a destination (data lake, data warehouse, analytics platform)
- ETL pipelines are essential for making raw data usable for analytics.
3. Data Science and ML Projects
- These projects involve applying statistical, mathematical, and machine learning techniques to extract insights and build predictive models from data.
- Common tasks: data exploration, feature engineering, model training and validation, deploying machine learning models, and evaluating results.
- Used in scenarios like fraud detection, recommendation systems, demand forecasting, etc.
4. Business Intelligence (BI) and Reporting
- Business Intelligence involves using software and tools to turn data into actionable insights for business decision-making.
- Reporting is the creation of dashboards, charts, graphs, and summaries to help organizations understand performance and trends.
- BI helps organizations monitor KPIs, sales, operations, and more, often using data from data warehouses.
5. Streaming and Real-Time Analytics
- Streaming analytics processes data continuously and in real-time as it arrives (rather than in batches).
- Used for monitoring, alerting, and analyzing time-sensitive data, such as website clicks, sensor data, financial transactions, or social media feeds.
- Enables immediate actions and decisions, e.g., fraud detection as transactions happen.
Here are practical examples for each concept, followed by a table summarizing the differences.
Examples for Each
1. Data Lakes & Data Warehouses
- Data Lake Example:
An e-commerce company stores all raw website logs, customer reviews (text), clickstreams, product images, and sales CSVs in a cloud data lake (e.g., AWS S3, Azure Data Lake). Data scientists use this raw data for various analytics and machine learning use cases. - Data Warehouse Example:
The same company transforms daily sales, customer, and inventory data into clean, structured tables in a data warehouse (e.g., Amazon Redshift, Snowflake, Google BigQuery) for business analysts to run sales and inventory reports.
2. ETL Pipelines
- Example:
A bank collects raw transaction records from multiple branches (Extract), cleans the data and flags suspicious activities (Transform), and then loads the final data into a central data warehouse (Load) for compliance and auditing.
3. Data Science and ML Projects
- Example:
A healthcare provider uses patient data to build a machine learning model that predicts which patients are at risk of readmission. Data scientists experiment, train, and deploy these models using Python and Databricks.
4. Business Intelligence and Reporting
- Example:
A retailer uses dashboards built in Power BI or Tableau to track daily sales, top-performing products, customer demographics, and regional performance, enabling managers to make quick business decisions.
5. Streaming and Real-Time Analytics
- Example:
A ride-sharing app (like Uber) processes real-time location data from drivers and riders, dynamically matches drivers to riders, and provides instant traffic analysis and estimated arrival times.
Table: Differences & Focus Areas
| Feature/Aspect | Data Lake | Data Warehouse | ETL Pipeline | Data Science/ML Project | BI & Reporting | Streaming/Real-Time Analytics |
|---|---|---|---|---|---|---|
| Purpose | Store all raw data | Store structured, ready-to-use data | Move, clean, and prepare data | Extract insights, predict outcomes | Summarize data for decisions | Process and analyze data as it arrives |
| Data Types | Raw (structured, semi, unstructured) | Structured (tables, columns) | Any (raw to structured) | Prepared (features, labels) | Aggregated/cleaned | Event/streaming, often raw or semi-structured |
| Users | Data scientists, engineers | Analysts, BI users | Data engineers, ETL developers | Data scientists, ML engineers | Business users, analysts | DevOps, analysts, engineers |
| Storage | Low-cost, flexible (S3, ADLS) | High-performance (Redshift, BigQuery) | Not a storage, but a pipeline | Not a storage, but a project space | Not a storage, but a tool | Often in-memory or stream storage |
| Query/Usage | Data exploration, ML, archiving | Reporting, dashboards | Input/output to storage | Model training, predictions | Visual reports, dashboards | Alerts, dashboards, real-time actions |
| Update Frequency | On-demand/batch | Batch/periodic | Batch or real-time | Ad hoc or periodic | Periodic or live | Real-time, continuous |
| Example Platform/Tool | AWS S3, Azure Data Lake | Snowflake, BigQuery | Apache NiFi, Airflow, Databricks Jobs | Databricks, Jupyter, scikit-learn | Power BI, Tableau, Looker | Apache Kafka, AWS Kinesis, Spark Streaming |
Category: