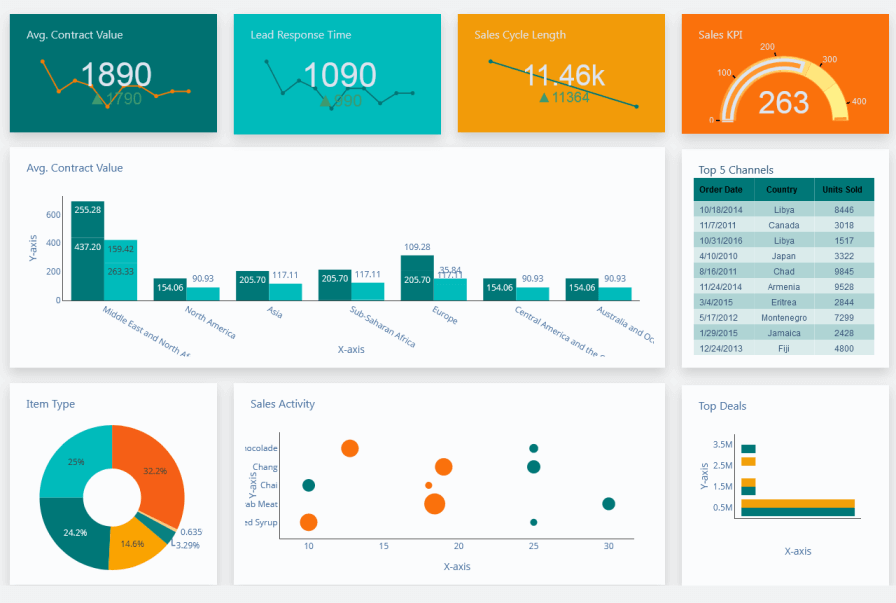
A KPI (Key Performance Indicator) Dashboard is a visual interface that aggregates and displays metrics in real time, allowing teams to track progress toward specific objectives. In the context of DevSecOps, these dashboards serve as real-time monitoring tools to assess the health, security, and performance of development, security, and operations workflows.
History or Background
Originated from business intelligence tools used in enterprise performance management.
Adopted in Agile, DevOps, and DevSecOps to track engineering effectiveness.
Tools like Grafana, Datadog, Kibana, and Power BI evolved to support security-related KPIs.
Why is it Relevant in DevSecOps?
Bridges visibility gaps between development, security, and operations teams.
Enables real-time decision making based on metrics such as deployment frequency, vulnerability counts, and mean time to remediate (MTTR).
Supports compliance and audit readiness with traceable metrics.
2. Core Concepts & Terminology
Key Terms and Definitions
Term
Definition
KPI
Key Performance Indicator – a measurable value tied to strategic objectives
MTTR
Mean Time to Remediate – average time taken to resolve issues
Change Failure Rate
Percentage of changes causing a failure in production
Lead Time for Changes
Time between code commit and production deployment
Dashboard Widget
A visual component (chart, table, gauge, etc.) representing a KPI
How It Fits into the DevSecOps Lifecycle
Plan: Track backlog items and security requirements.
Develop: Monitor secure coding practices and scan results.
Build/Test: Visualize code quality, test coverage, and vulnerability scan outcomes.
Release/Deploy: Measure deployment frequency and risk acceptance rates.
Operate: Monitor SLAs, incident rates, and MTTR.
Monitor: Display real-time alerts, logs, and compliance metrics.
Outcome: Improved SLA adherence and faster RCA cycles.
6. Benefits & Limitations
Key Advantages
Real-time visualization of DevSecOps metrics
Supports proactive remediation and response
Centralized visibility across tools and pipelines
Helps enforce security SLAs and audit readiness
Common Challenges or Limitations
Data silos across disparate tools
High initial setup complexity
Requires continuous maintenance and data hygiene
Alert fatigue from poorly tuned thresholds
7. Best Practices & Recommendations
Security Tips
Restrict dashboard access via SSO or IAM
Sanitize sensitive data in logs/metrics
Use TLS for dashboard interfaces
Performance & Maintenance
Archive old metrics to reduce storage bloat
Regularly update data source connectors
Monitor dashboard performance with load tests
Compliance Alignment
Tag compliance-specific KPIs (e.g., NIST, ISO)
Automate compliance status updates via dashboards
Automation Ideas
Auto-create incident tickets when thresholds breach
Rotate visualizations based on team shifts
Integrate AI anomaly detection in KPIs
8. Comparison with Alternatives
Feature
KPI Dashboard
Static Reports
SIEM Tools
Real-Time Updates
✅
❌
✅
Security-Specific KPIs
✅
⚠️
✅
Customizable
✅
❌
⚠️
Cost
Low/Medium
Low
High
Alert Integration
✅
❌
✅
When to Choose KPI Dashboards
When real-time security observability is needed
When you want cross-tool integration in one pane
For self-service analytics for teams
9. Conclusion
Final Thoughts
KPI Dashboards are the nervous system of DevSecOps, bringing visibility, control, and actionable insights. They promote cross-functional accountability, enhance response times, and ensure alignment with security and compliance goals.
Future Trends
AI-powered anomaly detection
Predictive KPI modeling
Integration with GitOps and Policy-as-Code
Next Steps
Identify critical KPIs for your team
Set up a prototype dashboard using open-source tools
Automate threshold-based alerts and remediation workflows
Introduction Learning DataOps only through theory is not enough. Beginners must work on practical projects to understand how data pipelines are designed, tested, automated, monitored, and improved…
Introduction Data is now one of the most important assets for modern organizations. Companies depend on data pipelines, analytics dashboards, reporting systems, cloud platforms, and automated workflows…
Introduction Stepping into the financial world can feel overwhelming, but securing high-quality stock market education is the ultimate way to build long-term wealth. For individuals starting their…
To win in the modern digital landscape, visibility is everything. Growing brands and busy agencies frequently struggle to balance keyword tracking, technical audits, content creation, creator outreach,…
Introduction Digital‑first businesses are under intense pressure to ship faster, stay secure, and scale reliably across complex multi‑cloud environments. Traditional ways of building and operating software cannot…
Introduction Modern enterprises face the monumental challenge of delivering software at breakneck speeds without sacrificing infrastructure stability. Relying on isolated development and operations teams is no longer…