KPI Dashboard in DevSecOps: A Comprehensive Tutorial

1. Introduction & Overview

What is a KPI Dashboard?

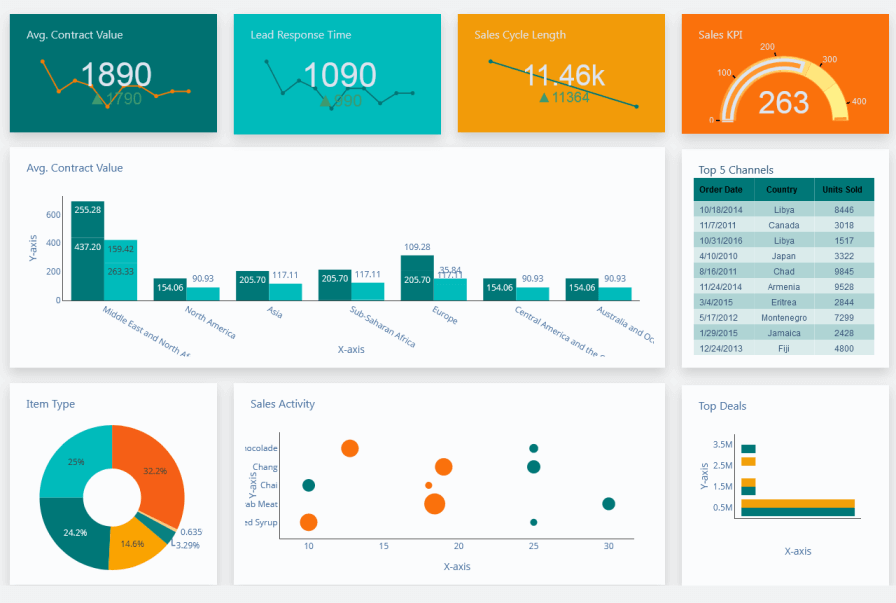
A KPI (Key Performance Indicator) Dashboard is a visual interface that aggregates and displays metrics in real time, allowing teams to track progress toward specific objectives. In the context of DevSecOps, these dashboards serve as real-time monitoring tools to assess the health, security, and performance of development, security, and operations workflows.

History or Background

  • Originated from business intelligence tools used in enterprise performance management.
  • Adopted in Agile, DevOps, and DevSecOps to track engineering effectiveness.
  • Tools like Grafana, Datadog, Kibana, and Power BI evolved to support security-related KPIs.

Why is it Relevant in DevSecOps?

  • Bridges visibility gaps between development, security, and operations teams.
  • Enables real-time decision making based on metrics such as deployment frequency, vulnerability counts, and mean time to remediate (MTTR).
  • Supports compliance and audit readiness with traceable metrics.

2. Core Concepts & Terminology

Key Terms and Definitions

TermDefinition
KPIKey Performance Indicator – a measurable value tied to strategic objectives
MTTRMean Time to Remediate – average time taken to resolve issues
Change Failure RatePercentage of changes causing a failure in production
Lead Time for ChangesTime between code commit and production deployment
Dashboard WidgetA visual component (chart, table, gauge, etc.) representing a KPI

How It Fits into the DevSecOps Lifecycle

  • Plan: Track backlog items and security requirements.
  • Develop: Monitor secure coding practices and scan results.
  • Build/Test: Visualize code quality, test coverage, and vulnerability scan outcomes.
  • Release/Deploy: Measure deployment frequency and risk acceptance rates.
  • Operate: Monitor SLAs, incident rates, and MTTR.
  • Monitor: Display real-time alerts, logs, and compliance metrics.

3. Architecture & How It Works

Components of a KPI Dashboard System

  1. Data Sources: CI/CD tools (e.g., Jenkins, GitHub Actions), security scanners (e.g., Snyk, Aqua), cloud platforms (e.g., AWS, Azure).
  2. ETL Pipeline: Extract, Transform, Load logic to normalize data.
  3. Backend: Metric aggregation and storage (e.g., Prometheus, Elasticsearch).
  4. Frontend UI: Visualization engine (e.g., Grafana, Kibana).
  5. Alerts and Triggers: Notification systems tied to KPIs.

Internal Workflow

  1. Data is ingested from various tools via APIs or agents.
  2. Metrics are transformed and normalized.
  3. Stored in time-series or log databases.
  4. Displayed on dashboard widgets.
  5. Alerts triggered based on thresholds or anomalies.

Architecture Diagram (Text Description)

[GitHub Actions] --->|
[Jenkins]        --->|                +-------------------+
[Snyk]           --->|                |    ETL Layer      |
[SonarQube]      --->|--------------->|  (Logstash, Airflow)
[CloudWatch]     --->|                +-------------------+
                                        ↓
                                    +--------+
                                    | Storage|  <-- Prometheus, Elastic
                                    +--------+
                                        ↓
                                +----------------+
                                |  KPI Dashboard  |
                                | (Grafana, Kibana)|
                                +----------------+
                                        ↓
                                [Email, Slack Alerts]

Integration Points with CI/CD or Cloud Tools

ToolIntegration Method
JenkinsREST API, Prometheus Plugin
GitHub ActionsWebhooks, API, GitHub Insights
SnykCLI + API integration
AWS CloudWatchMetrics export to Grafana
KubernetesPrometheus exporters

4. Installation & Getting Started

Basic Setup or Prerequisites

  • Docker or Kubernetes environment
  • Access to data sources (e.g., GitHub, Jenkins, security scanners)
  • Basic knowledge of Prometheus, Grafana
  • Admin privileges on the target cloud or CI/CD systems

Hands-On: Beginner-Friendly Setup

Step 1: Install Prometheus & Grafana with Docker

docker network create monitoring

docker run -d --name prometheus --network monitoring \
  -p 9090:9090 \
  -v ~/prometheus.yml:/etc/prometheus/prometheus.yml \
  prom/prometheus

docker run -d --name grafana --network monitoring \
  -p 3000:3000 \
  grafana/grafana

Step 2: Connect Prometheus to Grafana

  1. Open http://localhost:3000
  2. Login (default: admin/admin)
  3. Add data source → Choose Prometheus → Set URL as http://prometheus:9090

Step 3: Import DevSecOps KPI Dashboard Template

  • Use official dashboard JSONs or create widgets:
    • Deployment Frequency (Bar chart)
    • Security Scan Failures (Gauge)
    • Mean Time to Recovery (Line chart)

5. Real-World Use Cases

1. Vulnerability Management in CI

  • KPI: Number of critical vulnerabilities per release.
  • Toolchain: GitHub Actions + Snyk + Grafana
  • Impact: Reduce vulnerable builds by 60% after continuous visibility.

2. Cloud Security Compliance

  • KPI: Non-compliant resources detected per AWS account.
  • Toolchain: AWS Config + CloudWatch + Grafana
  • Use: Real-time SOC dashboard for ISO 27001 reporting.

3. Deployment Health Monitoring

  • KPI: Change failure rate and rollback incidents.
  • Toolchain: Jenkins + Prometheus + Alertmanager
  • Industry: Financial sector (PCI-DSS compliance)

4. Incident Management & MTTR

  • KPI: Time to acknowledge and resolve production incidents.
  • Toolchain: PagerDuty + Prometheus Alertmanager + Grafana
  • Outcome: Improved SLA adherence and faster RCA cycles.

6. Benefits & Limitations

Key Advantages

  • Real-time visualization of DevSecOps metrics
  • Supports proactive remediation and response
  • Centralized visibility across tools and pipelines
  • Helps enforce security SLAs and audit readiness

Common Challenges or Limitations

  • Data silos across disparate tools
  • High initial setup complexity
  • Requires continuous maintenance and data hygiene
  • Alert fatigue from poorly tuned thresholds

7. Best Practices & Recommendations

Security Tips

  • Restrict dashboard access via SSO or IAM
  • Sanitize sensitive data in logs/metrics
  • Use TLS for dashboard interfaces

Performance & Maintenance

  • Archive old metrics to reduce storage bloat
  • Regularly update data source connectors
  • Monitor dashboard performance with load tests

Compliance Alignment

  • Tag compliance-specific KPIs (e.g., NIST, ISO)
  • Automate compliance status updates via dashboards

Automation Ideas

  • Auto-create incident tickets when thresholds breach
  • Rotate visualizations based on team shifts
  • Integrate AI anomaly detection in KPIs

8. Comparison with Alternatives

FeatureKPI DashboardStatic ReportsSIEM Tools
Real-Time Updates✅❌✅
Security-Specific KPIs✅⚠️✅
Customizable✅❌⚠️
CostLow/MediumLowHigh
Alert Integration✅❌✅

When to Choose KPI Dashboards

  • When real-time security observability is needed
  • When you want cross-tool integration in one pane
  • For self-service analytics for teams

9. Conclusion

Final Thoughts

KPI Dashboards are the nervous system of DevSecOps, bringing visibility, control, and actionable insights. They promote cross-functional accountability, enhance response times, and ensure alignment with security and compliance goals.

Future Trends

  • AI-powered anomaly detection
  • Predictive KPI modeling
  • Integration with GitOps and Policy-as-Code

Next Steps

  • Identify critical KPIs for your team
  • Set up a prototype dashboard using open-source tools
  • Automate threshold-based alerts and remediation workflows

References & Communities


Related Posts

DevOps Training and Consulting in Japan: A Practical Enterprise Playbook

Software teams in Japan are under real pressure. Business leaders want new features every week. Customers expect apps to work all the time. But many internal teams…

Read More

Top DataOps Platforms for Analytics Teams: A Simple Guide to Picking the Right Tools

Introduction Picture an analyst opening a dashboard first thing in the morning. The sales chart is empty. A pipeline broke overnight, and nobody knows why. The analyst…

Read More

Fertility Treatment Options: IVF, ICSI, IUI and Other Approaches

Starting a family can feel very scary sometimes. You might feel lost in a sea of medical words. Many patients struggle to find honest facts and clear…

Read More

The Smart Way to Compare Software Before You Buy

Here’s something most software ads never admit: half the tools bought each year sit unused within three months. Sounds surprising? It shouldn’t. Bright banners promise magic fixes….

Read More

Upcoming Events in Hyderabad: Concerts, Comedy Shows & Workshops

Hyderabad is a busy city. Something new happens every week. New cafes open. Bands play live shows. Comedians make people laugh. But there is one big problem….

Read More

The Beginner Playbook for Fast, Reliable Analytics from DataOpsSchool

Introduction Your sales team asks for a minor dashboard tweak on Monday morning. You update the query, hit refresh, and wait. By Tuesday afternoon, the live revenue…
Read More

Leave a Reply