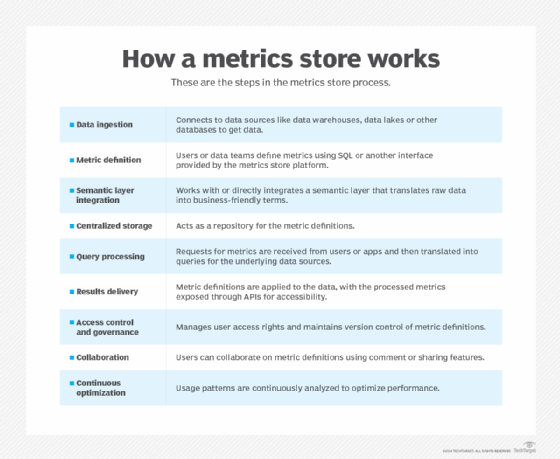
A Metrics Store is a centralized system designed to collect, store, manage, and serve time-series performance and operational metrics from applications, infrastructure, and pipelines. In DevSecOps, it plays a crucial role in observability, compliance monitoring, anomaly detection, and continuous feedback.
🕰️ History / Background
Origin: Derived from the evolution of monitoring systems like Nagios, metrics stores grew with the rise of cloud-native and microservices architectures.
Modern Adaptations: Prometheus, InfluxDB, and TimescaleDB became dominant open-source metrics stores.
Integrated into the DevSecOps toolchain for automated monitoring, alerting, and auditing.
🔐 Relevance in DevSecOps
Detect and respond to security anomalies
Measure compliance KPIs
Validate infrastructure hardening
Enable automated feedback loops with metrics
🧠 Core Concepts & Terminology
🗝️ Key Terms
Term
Definition
Time-Series
Data indexed in time order (e.g., CPU usage over time)
Labels/Tags
Key-value pairs to enrich metrics (e.g., env=prod)
Create a new dashboard with a panel using query: node_cpu_seconds_total
💼 Real-World Use Cases
1. Security Metrics Monitoring
Detect spike in failed logins from audit logs
Monitor intrusion attempts via network exporter
Correlate CVE detection metrics over time
2. Infrastructure Compliance
Track OS patch metrics across VMs
Alert when out-of-date components exceed policy limits
3. Application Performance Baseline
Measure API response times across environments
Flag degradation trends post-release
4. DevSecOps Audit Dashboard
Visualize build security scan results
Alert on deviation from secure baselines (e.g., SAST scores < 80%)
✅ Benefits & ⚠️ Limitations
✔️ Key Advantages
Centralized observability across DevSecOps
Seamless integration with CI/CD and cloud-native apps
Supports automation, alerting, and dashboards
Helps in compliance audits and SLO/SLA reporting
❌ Common Limitations
Limitation
Description
Scalability
May need long-term storage tuning
Storage Cost
High-resolution metrics = more storage
Data Noise
Excessive metric collection leads to clutter
Security
Metrics may expose internal details if misconfigured
🛠️ Best Practices & Recommendations
🔐 Security & Compliance
Enable TLS and auth on metrics endpoints
Sanitize sensitive labels and data (no passwords in metrics)
Align with CIS benchmarks and SOC2/ISO 27001 requirements
⚙️ Performance & Maintenance
Use metric cardinality control
Implement retention policies to manage volume
Aggregate old metrics to lower resolution (downsampling)
🤖 Automation Ideas
Automate alert rule updates via CI/CD
Tag all metrics with env, team, and app_id
Use anomaly detection plugins (Grafana ML, Prometheus adaptive alerts)
⚔️ Comparison with Alternatives
Feature
Prometheus
InfluxDB
TimescaleDB
Datadog (SaaS)
Open-source
✅
✅
✅
❌
Time-series DB
✅
✅
✅
✅
SQL-like Query
❌ (PromQL only)
Flux
PostgreSQL SQL
✅
Best for
Infra, K8s
IoT, Logs
Complex queries
Full observability
DevSecOps Fit
✅
✅
⚠️
✅
📌 When to Use a Metrics Store
Use a self-hosted metrics store like Prometheus when:
You want full control
Need to comply with data residency policies
Work in regulated environments
Use SaaS metrics platforms when:
You want ease of use
Prefer vendor-managed scalability and dashboards
📘 Conclusion
🔚 Final Thoughts
A Metrics Store is the heartbeat of observability in DevSecOps. It provides real-time visibility into performance, security, and compliance. When integrated properly, it empowers proactive risk management, performance tuning, and data-driven decision-making.
📈 Future Trends
AI/ML integration for predictive alerting
eBPF-based metrics collection for low-overhead observability
Introduction Learning DataOps only through theory is not enough. Beginners must work on practical projects to understand how data pipelines are designed, tested, automated, monitored, and improved…
Introduction Data is now one of the most important assets for modern organizations. Companies depend on data pipelines, analytics dashboards, reporting systems, cloud platforms, and automated workflows…
Introduction Stepping into the financial world can feel overwhelming, but securing high-quality stock market education is the ultimate way to build long-term wealth. For individuals starting their…
To win in the modern digital landscape, visibility is everything. Growing brands and busy agencies frequently struggle to balance keyword tracking, technical audits, content creation, creator outreach,…
Introduction Digital‑first businesses are under intense pressure to ship faster, stay secure, and scale reliably across complex multi‑cloud environments. Traditional ways of building and operating software cannot…
Introduction Modern enterprises face the monumental challenge of delivering software at breakneck speeds without sacrificing infrastructure stability. Relying on isolated development and operations teams is no longer…