Every day, companies collect information. A local grocery store tracks sales, a school counts attendance, and a shopping website records every order. To turn this raw information into helpful reports, businesses build digital pathways called data pipelines.
When these pathways work smoothly, leaders make smart choices. When they break, reports go blank, wrong orders ship, and nobody knows what is happening. This is why teams rely on DataOps pipeline monitoring to watch these systems around the clock. Whether you are taking your first steps in data engineering or exploring educational tutorials on DataOpsSchool.com, learning how to watch over pipelines is an essential first skill.
What Is a DataOps Pipeline?
A data pipeline is a series of automated steps that moves digital information from a starting point (source) to a storage space (destination).
DataOps brings ideas from software development (DevOps) into data work. It focuses on team collaboration, automation, continuous testing, and rapid delivery. A DataOps pipeline does not just shovel records from point A to point B; it checks itself, runs automated tests, and updates safely.
Data pipelines usually follow one of two patterns:
- ETL (Extract, Transform, Load): The system collects data (Extract), cleans or fixes it on a processing server (Transform), and writes it into storage (Load).
- ELT (Extract, Load, Transform): The system gathers raw data (Extract), places it directly into modern cloud storage (Load), and reshapes it inside the storage system (Transform).
Both patterns need teamwork and automation so engineers can push changes without breaking reports.
What Is DataOps Pipeline Monitoring?
DataOps pipeline monitoring means constantly checking the health, speed, and output of data pipelines.
Imagine a toy factory conveyor belt. If the belt stops moving, a light flashes. If the belt runs too slow, an alarm rings. If toys roll out missing their wheels, a sensor notices immediately.
Data pipeline monitoring works the same way:
- Health: It confirms whether a run succeeded or crashed.
- Speed: It records how long a task takes to finish.
- Completeness: It checks whether rows of data went missing.
- Alerts: It sends an automated text or message to engineers when errors happen.
Instead of waiting for a manager to complain about an empty dashboard, monitoring notifies the data team right away.
How a DataOps Pipeline Works
Data travels through several stages before reaching a dashboard. Problems can show up at any stop along the way:
- Data Collection: Gathering files or records from databases, sensors, or apps.Problem: The source app changes its login credentials, cutting off access.
- Data Ingestion: Reading incoming information and passing it into the data system.Problem: The internet connection drops, causing partial file transfers.
- Data Transformation: Cleaning raw input, calculating totals, and fixing date formats.Problem: An unexpected text string lands in a number column, causing code crashes.
- Data Validation: Testing records against safety rules.Problem: Half the rows have missing email addresses and fail quality checks.
- Data Storage: Saving processed tables into a database or warehouse.Problem: Storage runs out of allocated space.
- Data Delivery or Reporting: Feeding clean data into business dashboards.Problem: Reports refresh before the latest numbers finish saving.
Monitoring sits across every step to verify that inputs enter cleanly and outputs arrive as expected.
Why Is Monitoring DataOps Pipelines Important?
Monitoring protects teams from working blind. The core benefits include:
- Early Failure Detection: Catching a stopped job at midnight instead of discovering it at a morning meeting.
- Data Reliability: Ensuring leaders make business plans using consistent, trustworthy numbers.
- Data Quality Protection: Preventing scrambled or corrupted rows from infecting long-term storage.
- Less Manual Checking: Freeing engineers from opening system logs every morning to verify runs manually.
- Fast Troubleshooting: Directing developers straight to the broken line of code or missing file.
- Reduced Downtime: Fixing small delays before they pile up into large system outages.
Important Metrics for Monitoring DataOps Pipelines
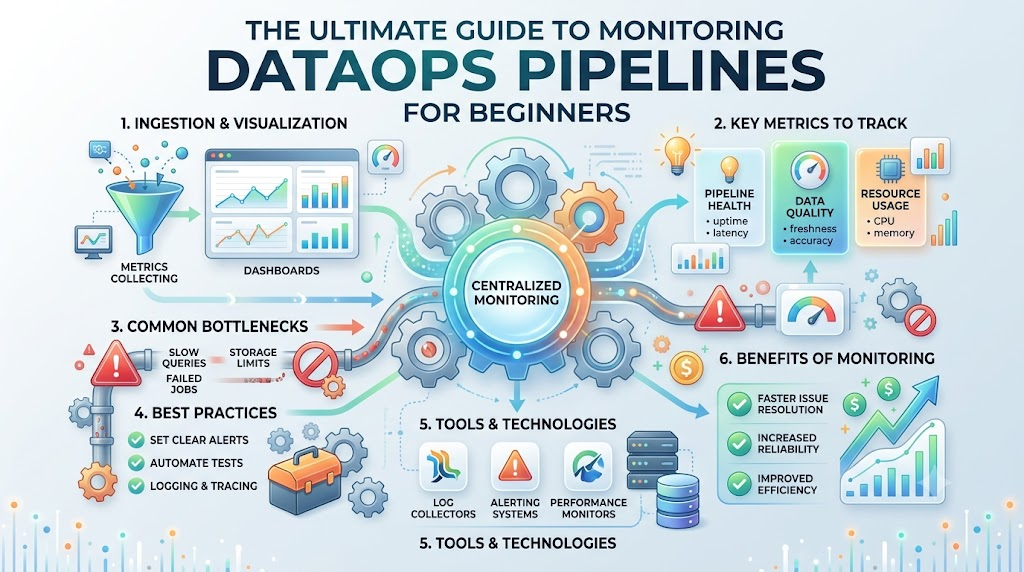
Pipelines generate measurements called metrics. Different systems need different metrics depending on how often they run, but these are the primary ones every beginner should know:
- Pipeline Success Rate: The percentage of runs that complete without crashing. If a pipeline runs 100 times and completes 98 times, its success rate is 98%.
- Pipeline Failure Rate: The percentage of runs that crash. A sudden spike usually points to broken source connections or bad code updates.
- Execution Time: How long a pipeline takes from start to finish. A job that normally takes 10 minutes but suddenly takes two hours points to a bottleneck.
- Data Freshness: The time gap between when an event occurs and when it becomes available in storage. An executive reviewing yesterday’s numbers on a real-time board suffers from poor freshness.
- Data Volume: The count of records or file size moving through the pipeline. Receiving 10 rows instead of the usual 10,000 indicates a collection issue.
- Data Completeness: The ratio of expected data that actually arrived. A file missing mandatory zip codes is incomplete.
- Data Accuracy: How well records conform to real-world facts and formatting rules. A recorded age of -5 or 250 years fails accuracy checks.
- Data Latency: The delay experienced by records as they move through individual processing stages.
- Data Throughput: The volume of records a pipeline processes per minute or second.
- Resource Usage: The amount of computer power (CPU, memory, storage) the pipeline consumes.
- Retry Count: How many times a failed step attempts to run again. A high retry count shows that a system is struggling with unstable networks or APIs.
- Alert Frequency: The total number of alarms sent to engineers. Too many alerts cause teams to tune out warnings.
Monitoring vs. Data Observability
Beginners often hear “monitoring” and “observability” used together. While they work toward the same goal, they solve different parts of a problem.
| Feature | Data Pipeline Monitoring | Data Observability |
| Main Question | “Is the pipeline working?” | “Why did the pipeline behave this way?” |
| Focus | Known rules, crashes, and status checks | Internal system states, patterns, and unexpected bugs |
| Action | Triggers an alert when a threshold breaks | Provides context across logs, traces, and metrics to find root causes |
| Scope | Point-in-time checks on steps or jobs | Deep, end-to-end visibility across data states and dependencies |
Monitoring tells you the car engine stopped running. Observability provides the sensor readouts, temperature histories, and wiring diagnostics to show you an electrical short caused the stop.
Common DataOps Pipeline Problems
- Pipeline Job Failure: An unexpected script error stops the run midway.
- Missing Source Data: An external partner forgets to upload their daily spreadsheet.
- Delayed Data: Slow network transfers deliver files two hours past the deadline.
- Incorrect Data Formats: A source system sends dates as
DD/MM/YYYYinstead of the expectedYYYY-MM-DD. - Schema Changes: A database manager renames a column from
Customer_IDtoUser_Numberwithout warning. - Duplicate Records: A network retry pushes the same order into the table twice.
- Null Values: Empty fields appear where mandatory data belongs.
- Slow Processing: Massive file sizes overwhelm available memory, slowing jobs to a crawl.
- API Connection Problems: A third-party service locks out your account after too many requests.
- Failed Data Quality Checks: Built-in validation rules halt a run because incoming values fail validation criteria.
How to Set Up Basic DataOps Pipeline Monitoring
Beginners do not need complicated setups to start monitoring. Following these ten steps builds a solid foundation:
- Understand the Pipeline Workflow: Diagram every step from raw source to final report.
- Identify Important Pipeline Stages: Pinpoint the sensitive conversion steps where errors happen most often.
- Select Useful Metrics: Pick two or three basic indicators, such as run status, run duration, and row counts.
- Set Reasonable Monitoring Rules: Define what counts as an error, such as a job running 30 minutes longer than normal.
- Create Basic Dashboards: Use clear visual charts to show daily pass/fail rates and job runtimes.
- Configure Meaningful Alerts: Route urgent failures to team chat channels or email.
- Add Data Quality Checks: Write tests to confirm key columns contain valid values before writing them to disk.
- Review Pipeline Logs: Read task output logs to verify that error messages point directly to the underlying problem.
- Test Failure Scenarios: Intentionally feed a malformed file into the pipeline to verify that alerts fire correctly.
- Improve Monitoring Over Time: Remove noisy warnings and add new checks as the system grows.
Tools Used for DataOps Pipeline Monitoring
Different layers of the pipeline call for different categories of monitoring software:
- Workflow Orchestration Tools: Platforms like Apache Airflow manage job orders, track task success or failure, and manage retries.
- Logging Systems: Tools that collect and store raw text output from scripts, helping engineers trace line-by-line errors.
- Metrics Dashboards: Visual tools, such as Grafana, that turn numerical data (like memory usage or run times) into charts.
- Data Quality Frameworks: Libraries such as Great Expectations that test rows against defined validation rules before storage.
- Alerting Systems: Notification platforms that ping team chat rooms or mobile devices when critical jobs stall.
- Cloud Platform Monitoring: Built-in tools provided by cloud vendors (such as AWS CloudWatch or Azure Monitor) to track compute power, server memory, and storage limits.
Common Beginner Mistakes
- Monitoring Only Pass/Fail Status: A job can complete successfully while writing zero rows to the destination. Always verify volume and data content alongside job completion.
- Ignoring Data Quality: Checking pipeline speed without validating data accuracy fills tables with clean-looking garbage.
- Creating Too Many Alerts: Blasting engineers with dozens of low-priority notifications leads to alert fatigue, causing teams to miss critical alarms.
- Vague Alert Messages: An alert that says “Error in step 3” wastes time. Alerts should specify the failed job name, the error type, and a direct link to the log.
- Skipping Freshness Checks: Assuming that an active pipeline guarantees up-to-date data. If new files never land in the intake folder, the pipeline processes old records repeatedly.
- Ignoring System Logs: Treating logs as an afterthought makes fixing crashes ten times slower.
- Monitoring Infrastructure Instead of Data: A server can show healthy CPU and RAM usage while the application running on it writes corrupted records. Monitor the data payloads directly.
Best Practices for DataOps Pipeline Monitoring
- Start Small: Track basic success, failure, and row volume before adding advanced metrics.
- Monitor the Full Journey: Check inputs at the source, transformations along the way, and outputs at the finish line.
- Implement Assertions: Add check stops that halt execution if critical columns contain invalid null values.
- Establish Ownership: Ensure every pipeline alert routes to a specific engineer or team responsible for fixing it.
- Store Historical Metrics: Keep records of daily runtimes so you can spot gradual performance declines over months.
- Document Recovery Steps: Write clear guides explaining how to restart broken pipelines and backfill missing data.
- Keep Alerts Actionable: If an alert does not require an immediate fix, turn it into a dashboard metric instead of a notification.
Beginner-Friendly Practical Example: Sales Data Pipeline
(Note: This is an illustrative example to show how monitoring catches real issues.)
Imagine a retail business that updates sales totals every night:
- Source: Cash registers save daily sales receipts into an online storage folder at 11:00 PM.
- Ingestion: At 11:30 PM, an automated ingestion script reads these receipts.
- Transformation: The script totals daily sales, calculates taxes, and strips out testing orders.
- Storage: Processed records land in the central sales database by 12:15 AM.
- Delivery: A morning sales dashboard reads the database at 6:00 AM for store managers.
Where Monitoring Steps In:
- Freshness Check (11:35 PM): The monitoring system looks for new receipt files. If the register software fails to upload them, the check raises an alert: “Missing daily receipts from Store #12.”
- Data Quality Check (11:45 PM): A validation test checks order prices. It spots an item priced at
-$45.00. Because negative prices are impossible, the pipeline quarantines the bad record and sends a notice: “Negative price detected in Order #8904.” - Volume Check (12:10 AM): The database records only 15 orders when the typical night sees 3,000. An alert fires: “Unusually low row volume.”
- Success Confirmation (12:15 AM): The pipeline completes successfully, updating the dashboard on time without manual intervention.
Frequently Asked Questions
What is DataOps pipeline monitoring?
DataOps pipeline monitoring is the practice of tracking the health, performance, speed, and data accuracy of data pipelines to detect and fix issues before they impact business decisions.
Why is monitoring important for data pipelines?
Monitoring helps data teams detect job crashes, pipeline delays, and corrupted data early, saving time and keeping reports reliable.
Which metrics should beginners monitor first?
Beginners should start by tracking pipeline run status (success or failure), job run duration, row volumes, and data freshness.
What is the difference between monitoring and observability?
Monitoring tracks predefined checks and thresholds to tell you if a pipeline is broken, while observability uses metrics, logs, and traces to explain why it broke.
How can engineers detect pipeline failures?
Failures are detected using automated workflow orchestrators that monitor exit codes, scan error logs, and issue notifications whenever a task halts unexpectedly.
What does data freshness mean?
Data freshness measures how current your data is by tracking the time difference between when an event happens in the real world and when it is processed and ready for use.
Can monitoring improve data quality?
Yes. Adding automated data tests to your monitoring pipeline catches invalid formats, duplicate rows, and missing values before they reach production databases.
Do beginners need expensive tools to monitor pipelines?
No. Beginners can monitor simple workflows using built-in orchestrator dashboards, lightweight open-source validation libraries, and basic email notifications.
How can a data team reduce alert fatigue?
Teams can reduce alert fatigue by sending alerts only for issues that require immediate action, turning non-critical warnings into dashboard charts, and setting realistic error thresholds.
Where can someone start learning more about DataOps practices?
Beginners can build hands-on skills by writing simple data pipelines, practicing with free open-source orchestration tools, and studying the tutorials and learning resources available at DataOpsSchool.com.
Conclusion
Building reliable data pipelines requires more than writing transformation code; it means ensuring that data flows predictably, accurately, and on schedule. By starting with fundamental metrics like job status, run duration, and row counts, beginners can catch pipeline failures early and protect the quality of their reporting. As data environments expand, adopting thoughtful monitoring practices transforms fragile data jobs into resilient systems that teams can depend on every single day.
