Imagine waking up to a frantic slack message from your finance team. They say your overnight sales reports show zero revenue for all of yesterday. You rush to your computer and open your monitoring dashboard. Everything looks completely green. No red lights flash. No error codes pop up on your screen. Your traditional monitoring tools missed a massive silent data failure entirely.
This frustrating scenario happens to data teams every single day around the world. Static rules and basic threshold checks cannot keep up with modern, fast-moving data streams. Your data pipelines grow more complex with every sprint you ship. You need a smarter way to catch errors before they ruin your business metrics. That smarter way is combining artificial intelligence with data operations, known as AIOps.
To master this modern shift, many teams turn to expert resources like DataOpsSchool.com for guidance. These platforms give you the practical blueprints you need to upgrade your monitoring stack. By adding machine learning to your observability workflows, you turn chaotic alert streams into clear, actionable insights. Let us explore how you can build this resilient monitoring machine today.
What Is AIOps in DataOps Monitoring?
AIOps stands for artificial intelligence for IT operations. In the world of DataOps, it means using smart algorithms to watch your data pipelines.
Traditional tools rely on fixed rules you write by hand. AIOps tools learn what normal behavior looks like over time. They spot weird changes automatically without you writing manual alert triggers.
Think of it like a smart thermostat in your house. Instead of you changing the temperature all day, it learns your habits. It keeps your rooms comfortable without constant human effort.
Why Traditional Monitoring Rules Fail Big Data Teams
Static monitoring rules work fine for simple, small databases. But modern data systems handle millions of events every single second.
When your data volume changes daily, fixed thresholds fail. If you set a rule for one thousand errors, a spike to nine hundred slips right past.
You spend hours updating rules every time your business grows. This manual work drains your engineering team’s energy and focus. You miss real bugs while chasing false alarms all day long.
How Machine Learning Spotlights Hidden Data Pipeline Issues
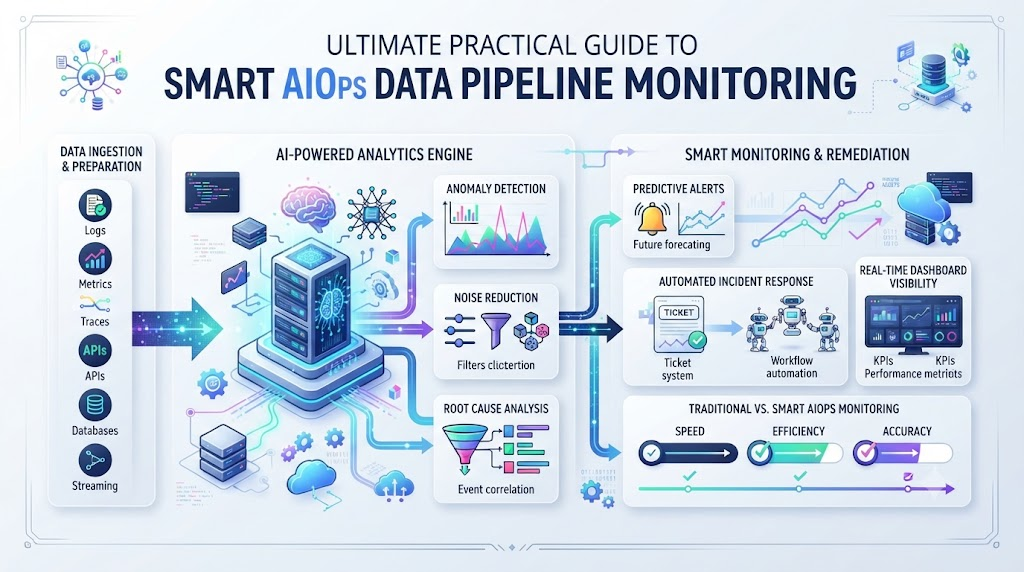
Machine learning models process massive amounts of historical data instantly. They look at seasonality, peak hours, and weekly traffic trends.
When a data flow drops or slows down unexpectedly, the model notices. It compares current patterns against months of past behavior in milliseconds.
This helps you catch silent data corruption before downstream users notice. You fix the root cause while your data consumers sleep peacefully.
The Power of Automated Root Cause Analysis
Finding where a pipeline broke takes precious hours of detective work. You dig through twenty different logs across multiple cloud services.
AIOps systems trace the exact origin of the failure for you. They connect downstream dashboard errors directly to the upstream database timeout.
Instead of guessing which table caused the crash, you get a direct answer. Your mean time to resolution drops from hours down to minutes.
Reducing Alert Fatigue for Happy Engineering Teams
Your phone buzzes twenty times an hour with useless warning messages. Most alerts turn out to be harmless noise that requires no action.
Engineers quickly learn to ignore the endless stream of notifications. This dangerous habit leads to missing critical alerts when real disasters strike.
AIOps filters out the noise and groups related alerts into single incidents. Your team only gets pinged when something truly requires human intervention.
Integrating Predictive Analytics Into Your Daily Workflows
Waiting for systems to crash is a stressful way to run engineering. You want to see problems coming before they impact your end users.
Predictive analytics look at trends to forecast future resource bottlenecks. They warn you when your storage disk will fill up next week.
You get time to scale your infrastructure during normal working hours. No more emergency midnight page-duty calls for your tired team.
Measuring Success with Smart Monitoring Metrics
You cannot improve what you do not measure in your engineering org. Tracking the right metrics proves the financial value of your AIOps setup.
Look at how fast your team detects and fixes pipeline failures. Measure the drop in false alerts and wasted compute resources.
Share these wins with company leaders to secure buy-in for future projects. Clear numbers make your engineering case undeniable to executive stakeholders.
Comparative Analysis: Traditional Monitoring Versus AIOps Systems
| Feature | Traditional Monitoring | AIOps-Driven Monitoring |
| Rule Setup | Manual thresholds written by engineers | Automated baseline learning from historical data |
| Alert Volume | High noise with many false positives | Low noise with grouped, prioritized incidents |
| Root Cause Speed | Hours of manual log diving | Seconds of automated path tracing |
| Failure Detection | Catches known failure patterns only | Catches unknown and silent data anomalies |
| Maintenance Cost | High effort updating rules constantly | Low maintenance through self-learning models |
Real-World Scenarios and Case Studies
- Scenario one: A retail company lost fifty thousand dollars when a data feed dropped null values. Their old rules missed the drop because total row count stayed flat. An AIOps model flagged the schema change instantly and saved the report.
- Scenario two: A streaming platform suffered daily database timeouts during peak evening hours. Engineers spent weeks guessing query bottlenecks without success. AIOps root cause analysis pinned the exact bad join query in two minutes.
- Scenario three: A fintech startup burned out engineers with over two hundred paging alerts every night. Moving to an AIOps grouping tool reduced notifications down to five real incidents per week.
- Scenario four: A healthcare provider faced strict compliance rules on data delivery deadlines. Predictive AIOps warnings alerted them to slow cloud storage nodes before any SLA breaches occurred.
- Scenario five: A logistics firm processed millions of GPS pings from delivery trucks worldwide. Network latency spikes triggered false panic alarms across twenty separate dashboard widgets every morning. AIOps baseline learning stopped the morning noise completely.
- Scenario six: A travel booking app experienced a silent pricing data corruption bug over a weekend. Traditional checks showed green lights because the server returned valid status codes. Machine learning anomaly detection caught the pricing variance within ten minutes.
- Scenario seven: A media publisher struggled with runaway cloud compute bills from rogue ETL jobs. An AIOps cost anomaly detector flagged the runaway spark cluster before billing got out of hand.
- Scenario eight: A SaaS provider had junior engineers afraid to touch production data pipelines alone. Automated runbook suggestions provided by the AIOps platform guided them safely through incident recovery steps.
- Scenario nine: An educational platform migrated massive student databases to a new cloud warehouse. Hidden schema mismatches caused silent reporting errors across historical analytics. AIOps semantic drift detection highlighted the exact field mismatches immediately.
- Scenario ten: A global energy company needed real-time pipeline visibility across remote field sensors. Implementing edge AIOps monitoring kept critical data flowing even during intermittent satellite connection drops.
Common Mistakes and Pitfalls in AIOps Adoption
- Mistake one: Feeding messy, low-quality log data into your machine learning training models. Fix this by cleaning and structuring your historical telemetry data before training starts.
- Mistake two: Setting up AI models without defining clear business goals or success metrics first. Fix this by mapping your monitoring strategy directly to key pipeline reliability KPIs.
- Mistake three: Trusting the AI black box completely without human review or validation steps. Fix this by keeping engineers in the loop to verify automated root cause findings.
- Mistake four: Ignoring team training and expecting engineers to understand new tools magically. Fix this by running hands-on workshops and documentation sessions for your entire data department.
- Mistake five: Trying to automate every single pipeline monitoring rule on day one. Fix this by starting with your most critical revenue pipeline and expanding slowly.
- Mistake six: Forgetting to adjust model sensitivity settings after major architectural software updates. Fix this by retraining your baseline models whenever your data schemas change significantly.
- Mistake seven: Treating AIOps as a one-time project instead of an ongoing operational practice. Fix this by scheduling monthly reviews to tune model performance and alert thresholds.
- Mistake eight: Overloading dashboards with too many complex AI metrics at the same time. Fix this by keeping engineer views simple, clean, and focused on actionable steps.
- Mistake nine: Failing to secure buy-in from senior leadership before purchasing expensive platform tools. Fix this by building a small proof-of-concept to prove clear financial return on investment.
- Mistake ten: Relying solely on automated alerts without setting up proper backup communication channels. Fix this by pairing smart alerts with reliable escalation paths for critical failures.
Step-by-Step Implementation Roadmap
- Audit your current monitoring setup to list every blind spot and noisy alert.
- Clean your historical log data to remove duplicate entries and corrupt telemetry files.
- Select your core AIOps platform and connect it to your primary data warehouse.
- Establish baseline performance metrics by letting the AI observe normal traffic for one week.
- Create your first automated anomaly detection rule for your most critical revenue pipeline.
- Configure alert routing rules to send high-priority incidents directly to the on-call engineer.
- Run a controlled chaos test by intentionally breaking a staging pipeline to test detection speed.
- Review initial alert accuracy with your team and tune sensitivity sliders to reduce noise.
- Expand AIOps monitoring coverage gradually to your secondary and tertiary data pipelines.
- Schedule monthly optimization reviews to keep your machine learning models accurate and reliable.
Final Recommendation and Next Steps
Start your AIOps journey today by auditing your current pipeline alert volume. Pick one messy data pipeline that causes the most night-time stress for your team. Connect a smart anomaly detection tool to watch that single data stream closely. Measure how much time you save during the first week of smart monitoring. Share those quick wins with your team to build momentum for a full rollout.
Frequently Asked Questions
1. What is the main benefit of using AIOps for data pipeline monitoring?
The main benefit is catching silent data errors and reducing alert noise automatically.
2. How does AIOps differ from traditional threshold monitoring?
Traditional monitoring uses fixed rules you write by hand, while AIOps learns normal patterns using machine learning.
3. Do I need a large data science team to set up AIOps?
No, modern AIOps platforms come with pre-built models that require zero machine learning coding skills.
4. How long does it take for an AIOps model to learn my data patterns?
Most systems need about one to two weeks of historical data to establish accurate baseline patterns.
5. Will AIOps completely replace my human data engineering team?
No, AIOps handles repetitive monitoring tasks so your engineers can focus on building new product features.
6. How do I stop AIOps from sending false positive alert notifications?
You tune the model sensitivity settings and provide feedback when an alert turns out to be harmless noise.
7. Can AIOps integrate with my existing Slack and PagerDuty tools?
Yes, most modern AIOps solutions connect seamlessly with standard developer communication and ticketing systems.
8. What should I do if my data pipeline schema changes frequently?
You must retrain or update your AIOps baseline models whenever you make major changes to your database schemas.
9. Is AIOps suitable for small startup teams with limited budgets?
Yes, starting with small open-source or lightweight cloud tools helps startups scale monitoring without massive costs.
10. How do I prove the return on investment of AIOps to company leaders?
Track metrics like reduced mean time to resolution, lower cloud waste, and fewer missed data SLAs.
