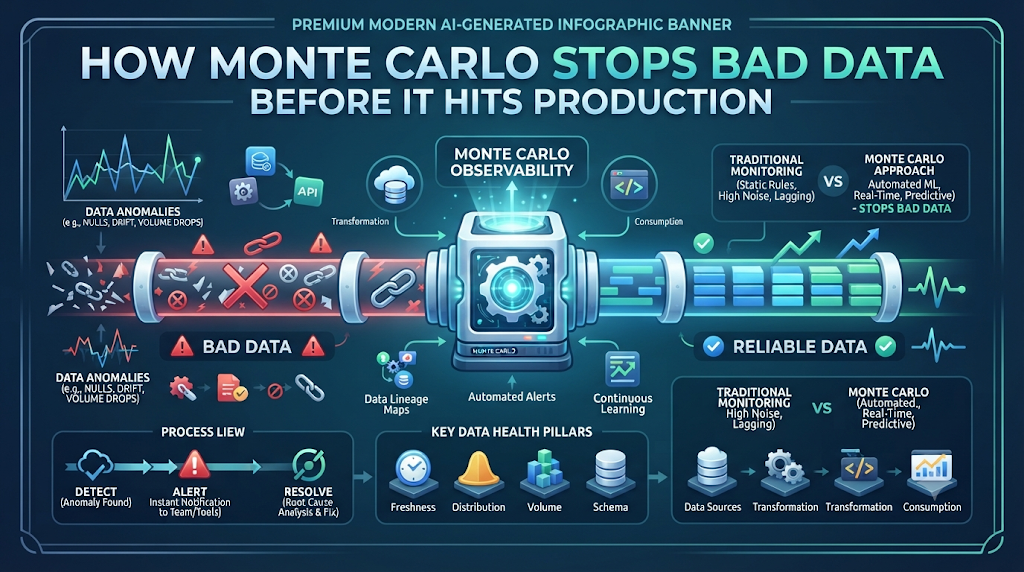
Data breaks fast. One small schema change in a upstream table can completely wipe out your daily revenue reports. You find out only when your boss asks why the dashboard looks empty. By then, trust is already broken.
To fix this, smart teams use methods taught at DataOpsSchool.com to catch issues early. They use probabilistic math to model uncertainty. This approach is known as Monte Carlo data observability. It treats data health like software uptime. Instead of guessing if numbers are right, you let math test thousands of possible futures. You see problems before your users do.
What Is Data Observability and Why You Need It
Data observability is your window into the health of your data. Think of it like system logs for your databases. Traditional monitoring tells you when a job fails. Observability tells you why the data looks weird even when the job succeeds.
Pipelines have many moving parts. Data moves from sources through transformations to BI tools. Each step can introduce errors. Null values creep in, counts drop, and types change unexpectedly. Without observability, you rely on manual checks. Manual checks miss hidden issues that pile up over time.
Understanding the Monte Carlo Method in Plain English
The Monte Carlo method sounds complex, but the core idea is simple. You run random trials to see what could happen. Imagine you want to know if your pipeline can handle a massive spike in traffic. Instead of guessing, you simulate ten thousand random load patterns.
You see the average outcome and the worst-case scenario. This gives you a clear safety margin. In data quality, you simulate normal ranges for row counts, freshness, and null rates. If new data falls outside your safe zone, the system flags it. You do not need to write custom rules for every single table. The math learns normal patterns on its own.
Why Traditional Data Testing Fails
Static tests check if a column is greater than zero. That works until business logic changes. Then your static test fails and wakes you up at midnight for no reason. Alert fatigue sets in fast. You start ignoring alerts because most of them are false alarms. Then a real bug slips past your tired eyes.
Static tests cannot adapt to seasonality. Sales drop on weekends, which is normal, but a static rule might flag it as an outage. Monte Carlo methods look at historical trends. They know that weekend drops are normal and stay quiet.
Key Pillars of Data Observability
Data health rests on a few core pillars. You must track all of them to keep your pipelines clean. Freshness is the first pillar. You need to know if your data is arriving on time. Distribution is the second pillar. You check if the values inside your columns look healthy. Volume is the third pillar. You monitor row counts to spot unexpected data loss.
Schema is the final pillar. You track who changed table structures and when.
| Pillar | What It Tracks | Why It Matters |
| Freshness | Table update times | Catches delayed pipelines |
| Distribution | Value patterns and types | Spots corrupt data entries |
| Volume | Row and column counts | Detects missing or extra data |
| Schema | Table structure changes | Prevents downstream breaks |
How Monte Carlo Integrates with Your Modern Data Stack
Your data stack has many tools. You use cloud warehouses, orchestration tools, and transformation layers. Monte Carlo observability plugs right into these tools. It listens to your warehouse query logs and metadata. It does not touch your raw data payloads. This keeps your data secure and fast.
It reads metadata to learn table shapes and query patterns. It builds a behavioral model of your entire data ecosystem. When something looks unusual, it sends an alert to your Slack or PagerDuty. Your team gets context right away.
Real-World Story About Server Crashes and Data Outages
- A midnight cron job ran out of memory, leaving our main analytics table half empty and causing our morning dashboards to show zero users.
- An upstream vendor changed a date format from text to epoch time, breaking every downstream join in our customer retention model.
- A rogue test script dumped millions of duplicate rows into our production database, distorting our monthly revenue totals by forty percent.
- A sudden network timeout interrupted our data loader, creating silent gaps in our inventory logs that we only found weeks later.
- A schema migration dropped a required foreign key constraint, allowing corrupted orphan records to flood our core user profile tables.
- A cloud region outage froze our streaming ingestion pipeline, creating a massive backlog that delayed critical fraud detection alerts.
- A developer accidentally hardcoded a test filter in a production view, hiding all transactions from our top three enterprise clients.
- A memory leak in our custom transformation script crashed the worker node, corrupting state files and halting all reporting updates.
- An expired API token blocked our marketing data sync, leaving our growth team blind to yesterday’s ad spend performance.
- A subtle floating-point rounding error in our currency conversion pipeline slowly skewed our international profit margins over six months.
Common Mistakes and Pitfalls
- Mistake: Setting up alerts for every single table right away.Fix: Start with your top ten core revenue tables before expanding coverage.
- Mistake: Ignoring seasonal trends in your data distribution.Fix: Choose monitoring tools that automatically account for weekly and monthly cycles.
- Mistake: Relying solely on manual SQL queries for health checks.Fix: Automate anomaly detection to catch silent failures while you sleep.
- Mistake: Giving everyone permission to modify data alert thresholds.Fix: Assign a single data reliability owner to manage alert rules and ownership.
- Mistake: Treating data observability as a one-time setup task.Fix: Review and tune your alert channels monthly to prevent alert fatigue.
- Mistake: Monitoring staging environments instead of production data.Fix: Focus your observability budget on downstream consumer-facing production assets.
- Mistake: Failing to map out data lineage before adding monitors.Fix: Build a clear dependency graph so you can trace root causes instantly.
- Mistake: Ignoring schema changes because they look minor.Fix: Set up instant alerts for any column drops or type alterations.
- Mistake: Keeping data quality ownership isolated from engineering teams.Fix: Make data producers responsible for the health of the data they output.
- Mistake: Buying complex tools without a clear adoption plan.Fix: Define success metrics like mean time to detection before rolling out software.
Step-by-Step Implementation Roadmap
- Audit your current data warehouse to list all core business-critical tables and views.
- Map your data lineage to see which upstream pipelines feed your key reports.
- Define acceptable thresholds for freshness, volume, and distribution on your top tables.
- Connect your chosen observability platform to your data warehouse query history logs.
- Set up initial automated monitors for table freshness and row count anomalies.
- Route high-priority alerts to your team’s main Slack channel or paging tool.
- Train your data engineers on how to investigate root causes using lineage maps.
- Expand anomaly detection to column-level distributions and null value checks.
- Establish clear data ownership tags so everyone knows who fixes broken tables.
- Review incident response metrics monthly to reduce your mean time to resolution.
Frequently Asked Questions
1. What is Monte Carlo data observability?
It is a modern approach to data health that uses automated monitoring and probabilistic math to detect pipeline issues, schema changes, and anomalies before they impact users.
2. How does the Monte Carlo method apply to databases?
Instead of writing rigid rules for every table, the system uses historical patterns to simulate normal behavior and flags data that falls outside safe statistical boundaries.
3. Why are traditional data tests not enough?
Static tests create alert fatigue and break when business logic changes. They cannot adapt to normal seasonal shifts like weekend drops in user activity.
4. What are the four pillars of data observability?
The four pillars are freshness, distribution, volume, and schema. Tracking all four gives you complete visibility into your pipeline health.
5. Does data observability slow down my warehouse?
No. Modern tools read query logs, metadata, and system tables instead of scanning your raw data payloads, keeping your warehouse fast and secure.
6. How do I start implementing data observability?
Begin by auditing your most critical revenue tables, mapping their upstream lineage, and setting up basic freshness and volume alerts on those assets first.
7. Who should own data quality in an organization?
Data producers should own the health of the data they create, while data engineering and analytics teams monitor overall pipeline reliability and triage alerts.
8. How do I prevent alert fatigue?
Start with a small set of monitors on core tables, tune your thresholds based on historical trends, and disable noisy alerts that do not require action.
9. What is the difference between monitoring and observability?
Monitoring tells you when a job fails or crashes. Observability tells you why the data looks incorrect even when the underlying job runs successfully.
10. How long does it take to see value from observability?
Most teams catch their first hidden data anomaly within the first few days of connecting their warehouse metadata and setting up initial baseline monitors.
Final Recommendation and Next Steps
Start small to build confidence in your data observability setup. Pick your most important dashboard today and map its upstream sources. Set up basic freshness and volume alerts for those specific tables. Watch how the system reacts over the next week. Tune the thresholds until your alerts are quiet and accurate. Once your team trusts the system, expand coverage to the rest of your data warehouse. Reliable data leads to better decisions and happier stakeholders. Take the first step today and make your data pipelines bulletproof.
