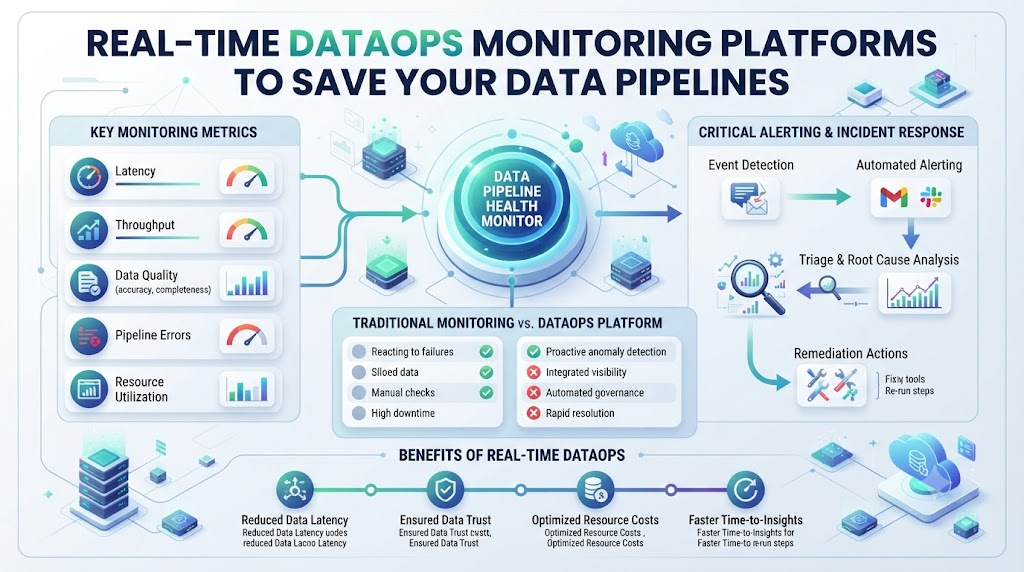
Data streams never sleep. When a pipeline breaks at midnight, your team needs to know right away. You cannot wait for a morning report to find out that half your customer data vanished.
Good monitoring tools watch your data flow every single second. They send quick alerts so you can fix small issues before they turn into massive system crashes.
If you want to learn more about keeping your data workflows clean and fast, check out DataOpsSchool.com for expert training. Let us look at how these tools work and how you can use them to protect your business.
Why Real-Time Monitoring Matters
Data pipelines move fast. They pull information from apps, websites, and sales tools into one central place. If one step breaks, the whole system stops.
Traditional checks only look at data once a day. That is too slow. Real-time tools watch every single record as it moves. They catch bad data formats, missing fields, and sudden traffic drops instantly.
What Is a DataOps Pipeline?
A DataOps pipeline is a series of automated steps. It gathers, cleans, and moves data from source to destination. Think of it like a water pipe system for your company’s digital lifeblood.
When a pipe cracks, you need to turn off the water fast. In the same way, when data gets corrupted, your monitoring tool acts like an alarm. It tells you the exact spot where the leak happened.
Key Features to Look For
Not all monitoring tools are built the same. You need to pick a platform that fits your tech stack and your budget.
Look for tools that offer live dashboards, smart alerts, and easy setup. If a tool takes months to install, it will slow you down. You want something that works right out of the box.
Real-Time Data vs. Batch Processing
Batch processing is like collecting your mail once a week. Real-time data is like getting a text message the moment a letter arrives.
Batch systems can hide errors for days. Real-time monitoring shows you errors the second they happen. This speed saves you hours of painful debugging later.
How Smart Alerts Save Time
Old monitoring tools send too many false alarms. Your phone buzzes all night for tiny issues that do not matter. This is called alert fatigue.
Modern platforms use smart rules. They only wake you up when a real disaster happens. They group similar errors together so you see the big picture fast.
Cost Versus Value of Monitoring Tools
Good monitoring software costs money. But fixing a broken database costs much more in lost sales and angry customers.
Think of monitoring as insurance. It protects your daily operations and gives your engineers peace of mind so they can sleep at night.
Real-World Story About Server Crashes
- A sudden spike in user signups crashed a main database server, stopping all user logins for two hours.
- An outdated script failed to process leap year dates, causing order totals to display as zero dollars.
- A network cable cut by construction workers severed the link between the cloud warehouse and the payment gateway.
- A memory leak in a log parser consumed all server RAM, freezing the entire analytics pipeline mid-afternoon.
- An expired security certificate blocked all incoming data feeds from the mobile app without any warning.
- A bad code deploy dropped a key table column, breaking every downstream data model and report instantly.
- A sudden surge in bot traffic flooded the ingestion queue, causing a massive processing backlog and high server costs.
- A hard drive failure on a local backup node corrupted historical log files before the replica could sync.
- A misconfigured firewall rule blocked legitimate data traffic from the new European branch office.
- An unhandled null value in a customer profile update crashed the ingestion worker thread in an infinite loop.
Comparing Monitoring Approaches
| Feature | Old Batch Monitoring | Modern Real-Time Monitoring |
| Speed | Once a day or once an hour | Every single second |
| Alerts | Loud, noisy, and often wrong | Smart, targeted, and grouped |
| Fix Time | Hours or days of searching | Minutes with exact error location |
| Setup | Hard to connect and maintain | Fast plug-and-play integrations |
| Cost Impact | High hidden cost from delayed fixes | Low cost with high preventive value |
Common Mistakes and Pitfalls
- Mistake: Setting up zero alerts and waiting for customers to report bugs. Fix: Create basic alerts for high-priority pipeline failures today.
- Mistake: Tracking every tiny metric until your dashboard is too noisy to read. Fix: Focus only on key health indicators like error rates and latency.
- Mistake: Ignoring warning signs until a minor glitch turns into a full system outage. Fix: Set up early warning triggers for unusual traffic drops.
- Mistake: Giving every team member admin access to change monitoring rules. Fix: Assign clear roles and limit edit rights to senior engineers.
- Mistake: Failing to test your alert system during normal working hours. Fix: Run a monthly fire drill to make sure notifications reach your phone.
- Mistake: Choosing a tool that does not scale as your company adds more data. Fix: Pick cloud-native platforms that grow with your data volume.
- Mistake: Relying on a single person to watch the dashboard all day long. Fix: Automate notifications so the right person gets pinged automatically.
- Mistake: Skipping documentation for custom alert scripts and rules. Fix: Keep a simple README file explaining what each alert means.
- Mistake: Overcomplicating dashboard charts with confusing colors and numbers. Fix: Keep visuals clean, simple, and easy to understand at a glance.
- Mistake: Forgetting to monitor the monitoring tool itself. Fix: Set up an external health check for your monitoring server.
Step-by-Step Implementation Roadmap
- Audit your current data flow: Map out every source, pipeline, and destination to see where data moves.
- Define your core health metrics: Choose three vital numbers, such as row count, latency, and error rate.
- Select your monitoring platform: Pick a tool that matches your cloud provider and your team’s skill level.
- Install the tracking agents: Connect the monitoring software to your staging pipeline first to test it safely.
- Set up basic alerts: Configure notifications for critical failures like connection timeouts and empty data files.
- Test the alert channels: Send a test alert to your team chat app to ensure notifications work properly.
- Expand to production: Roll out the monitoring agents to your live customer-facing data pipelines.
- Tune out noise: Adjust your alert thresholds to stop false alarms and reduce team stress.
- Train your team: Teach your engineers how to read the new dashboards and respond to incidents.
- Review and improve: Hold a monthly meeting to update your rules and make your pipelines even stronger.
Frequently Asked Questions
1. What is a real-time dataops monitoring platform?
It is a software tool that watches your data pipelines every second to catch errors, delays, and broken connections instantly.
2. How do these tools prevent data loss?
They send immediate alerts when data stops flowing or gets corrupted so your team can fix the issue before data disappears.
3. Are these platforms hard to install?
Most modern tools offer simple plugins and connectors that link to your existing data warehouse in just a few minutes.
4. How many metrics should I track on my dashboard?
Start with three to five key metrics like record count, run time, and error rate to keep things clear and simple.
5. What causes alert fatigue in monitoring tools?
Getting too many noisy notifications for minor issues makes teams ignore important warnings when real problems happen.
6. Can small businesses use real-time monitoring?
Yes, many cloud platforms offer affordable pricing tiers designed for startups and small engineering teams.
7. How does real-time monitoring differ from batch checking?
Batch checking looks at data once a day, while real-time monitoring tracks every single record as it passes through.
8. What should I do when an alert goes off?
Check the error logs provided by the tool to find the exact line of code or server causing the delay.
9. Do I need coding skills to set up these tools?
Basic tools use simple visual dashboards, but knowing a bit of SQL or Python helps you build custom rules.
10. How often should I update my monitoring rules?
Review your rules every quarter to match changes in your business data and new software updates.
Final Recommendation and Next Steps
Do not wait for a major server crash to start tracking your data pipelines. Pick one core pipeline today and add a simple monitoring tool to watch its health.
Train your team on how to read the alerts and respond quickly. Taking these small steps now will save your company hours of stress and keep your data clean and reliable every single day.
