1. Introduction & Overview
What are BI Tools?
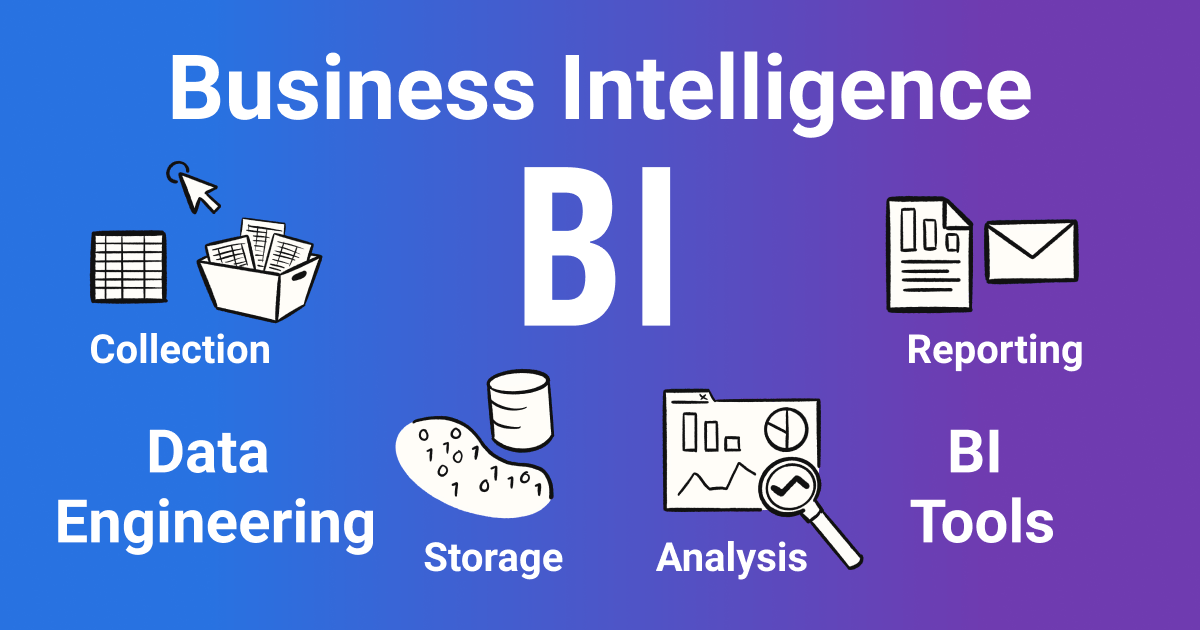
Business Intelligence (BI) Tools are software applications that help organizations analyze, visualize, and report on data to make informed decisions. They connect to multiple data sources, process raw information, and deliver insights through dashboards, reports, and analytics.
In the context of DataOps, BI tools play a critical role at the final stage of the data lifecycle — enabling business stakeholders to consume high-quality, validated, and timely data.
History or Background
- 1960s–1970s: Early decision support systems (DSS) introduced.
- 1980s–1990s: Relational databases & data warehouses (e.g., Oracle, SAP BW).
- 2000s: Rise of self-service BI (Tableau, Qlik, Power BI).
- 2010s onwards: Cloud-based BI, real-time dashboards, and integration with DataOps pipelines.
Why is it Relevant in DataOps?
- Ensures data reliability by using automated pipelines.
- Supports agile iteration: business users get updated dashboards with every CI/CD pipeline run.
- Helps break down silos by connecting engineering, data science, and business teams.
- Enables continuous monitoring of business KPIs alongside operational monitoring.
2. Core Concepts & Terminology
Key Terms and Definitions
| Term | Definition |
|---|---|
| ETL/ELT | Process of extracting, transforming, and loading data into BI tools. |
| Dashboard | Interactive visualization layer for decision-making. |
| KPI | Key Performance Indicator – business-focused metric. |
| DataOps | Methodology applying DevOps principles to data pipelines. |
| Data Quality Validation | Ensures clean, reliable data before BI consumption. |
| Semantic Layer | Business-friendly abstraction of complex datasets. |
How BI Tools Fit into the DataOps Lifecycle
- Data Ingestion → Raw data collected.
- Transformation & Validation → DataOps ensures quality.
- Data Storage → Data warehouse or lake.
- Orchestration → CI/CD automates workflows.
- Visualization & Consumption → BI tools deliver final insights.
👉 BI tools act as the end-user interface of the DataOps pipeline.
3. Architecture & How It Works
Components & Internal Workflow
- Data Sources – Databases, APIs, logs, IoT streams.
- ETL/ELT Layer – Prepares structured data.
- Data Warehouse / Data Lake – Central storage.
- Semantic Layer – Maps business rules.
- BI Tool Engine – Runs queries, generates reports.
- Visualization Layer – Dashboards, charts, ad-hoc queries.
Architecture Diagram (Textual Description)
 [Raw Data Sources]
        ↓
   [ETL/ELT Pipelines] --(Managed via DataOps)--> [Data Lake/Warehouse]
        ↓
 [Semantic Layer / Business Model]
        ↓
       [BI Tool Engine]
        ↓
   [Dashboards / Reports / APIs for Business Users]
Integration with CI/CD or Cloud Tools
- CI/CD Pipelines: Automatically refresh BI datasets after every successful data pipeline execution.
- Cloud Integration:
- Power BI + Azure Data Factory
- Looker + Google BigQuery
- Tableau + AWS Redshift/Snowflake
4. Installation & Getting Started
Basic Setup or Prerequisites
- A data warehouse (Snowflake, BigQuery, Redshift, PostgreSQL).
- BI tool account (Power BI, Tableau, Looker, Metabase).
- API or ODBC/JDBC drivers to connect data sources.
Hands-On: Step-by-Step Beginner-Friendly Setup (Example: Metabase)
- Install Metabase via Docker
docker run -d -p 3000:3000 --name metabase metabase/metabase - Access Metabase →
http://localhost:3000 - Set Admin Credentials → Create first user.
- Connect Data Source → Choose PostgreSQL/MySQL/BigQuery.
- Build First Dashboard → Use drag-and-drop query builder.
- Schedule Refresh → Automate dataset updates daily/hourly.
Similar setup applies for Tableau (Desktop + Server) or Power BI (Desktop + Service).
5. Real-World Use Cases
Use Case 1: Financial Services – Fraud Detection
- DataOps ensures real-time ingestion from transaction logs.
- BI dashboards alert analysts of anomalies.
Use Case 2: Retail – Inventory Optimization
- Pipeline validates sales & stock data.
- BI dashboards show SKU-wise performance.
Use Case 3: Healthcare – Patient Analytics
- DataOps validates clinical data.
- BI tools show treatment outcomes and KPIs.
Use Case 4: SaaS Industry – Product Usage Insights
- Streaming logs processed via DataOps.
- BI dashboards show active users, churn risk, feature adoption.
6. Benefits & Limitations
Key Advantages
Democratizes data access for non-technical teams.
Reduces manual reporting effort.
Integrates with CI/CD pipelines for real-time insights.
Enhances collaboration between data engineers & business units.
Common Challenges
Performance bottlenecks with very large datasets.
Licensing costs (Tableau, Power BI enterprise).
Security concerns if governance is weak.
Complexity in managing multiple data sources.
7. Best Practices & Recommendations
- Security: Implement role-based access, integrate with SSO.
- Performance: Pre-aggregate large datasets, use materialized views.
- Automation: Link BI refresh schedules to CI/CD pipeline events.
- Compliance: Align dashboards with GDPR/HIPAA rules if handling PII.
- Monitoring: Use DataOps observability to track dashboard performance.
8. Comparison with Alternatives
| Feature | Traditional Reporting | BI Tools | Data Science Dashboards |
|---|---|---|---|
| Audience | Internal teams | Business users | Data scientists |
| Agility | Slow, static | Fast, interactive | Customizable |
| Automation | Limited | Strong CI/CD & refresh | Script-driven |
| Cost | Low | Medium–High | Medium |
👉 Choose BI Tools when:
- Business users need self-service analytics.
- Dashboards must refresh automatically with pipelines.
- Integration with cloud warehouses is required.
9. Conclusion
Final Thoughts
BI tools act as the last-mile enabler of DataOps pipelines, transforming raw and validated data into actionable insights. They bridge the gap between technical data engineering workflows and business decision-making.
Future Trends
- AI-powered BI (natural language queries, predictive dashboards).
- Embedded BI inside applications.
- DataOps-native BI tools that integrate observability and governance.
Next Steps
- Start with open-source BI tools like Metabase or Apache Superset.
- Experiment with CI/CD integration for automated dataset refreshes.
- Scale to enterprise tools (Power BI, Tableau, Looker) when needed.
References & Communities
- Tableau Official Docs
- Power BI Docs
- Metabase Docs
- Apache Superset