1. Introduction & Overview
What are Audit Logs?
Audit logs are chronological records of system events and user actions that capture what happened, when it happened, who performed it, and how it affected data or systems. They serve as the “black box” of a DataOps ecosystem, ensuring visibility, accountability, and compliance in data pipelines.
In simple terms:
- Who did what?
- When was it done?
- What was affected?
- How was it executed?
History or Background
- Audit logging originates from traditional IT security and system administration, where logs were used to troubleshoot and monitor activity.
- In the 2000s, regulatory frameworks (HIPAA, SOX, GDPR) emphasized audit trails for compliance.
- In modern DataOps, audit logs evolved into a critical component to monitor, validate, and govern data pipelines in real-time.
Why is it Relevant in DataOps?
- DataOps pipelines involve continuous integration, automated data flows, and distributed teams. Without audit logs, it’s nearly impossible to trace failures or unauthorized access.
- Ensures compliance with data privacy regulations.
- Enables root-cause analysis of failures or anomalies in pipelines.
- Facilitates trust in data by proving that transformations and movements are fully traceable.
2. Core Concepts & Terminology
Key Terms
| Term | Definition |
|---|---|
| Audit Log | A structured record of system or user activity. |
| Audit Trail | The chronological chain of audit logs showing a full activity sequence. |
| Event | Any action performed on a system (login, query, job execution). |
| Metadata | Contextual information (user ID, timestamp, IP address, system name). |
| Immutable Storage | Logs must be tamper-proof to maintain trust. |
| Retention Policy | The duration for which logs are stored. |
How Audit Logs Fit into the DataOps Lifecycle
- Data Ingestion → Track who loaded the data and when.
- Transformation → Record SQL queries, ETL scripts, or code that transformed datasets.
- Testing/Validation → Log schema validation failures or unit test results.
- Deployment → Audit pipeline changes and approvals in CI/CD.
- Monitoring & Governance → Provide transparency for compliance, audits, and investigations.
3. Architecture & How It Works
Components
- Event Collectors – Capture raw activity (API calls, SQL queries, user actions).
- Log Aggregator – Central system (e.g., ELK stack, Splunk, Cloud Logging).
- Immutable Storage – Write-once storage (e.g., AWS S3 with Object Lock).
- Analyzer – Real-time or batch analysis engine for anomaly detection.
- Dashboard/Visualization – Human-readable interfaces for auditing.
Internal Workflow
- Event Triggered → User or system action occurs.
- Event Recorded → Metadata is captured (timestamp, actor, action).
- Log Forwarding → Events shipped to log collector.
- Storage & Processing → Logs stored in immutable backend.
- Monitoring & Alerting → Alerts triggered on suspicious activity.
- Audit & Reporting → Regulators or admins view structured logs.
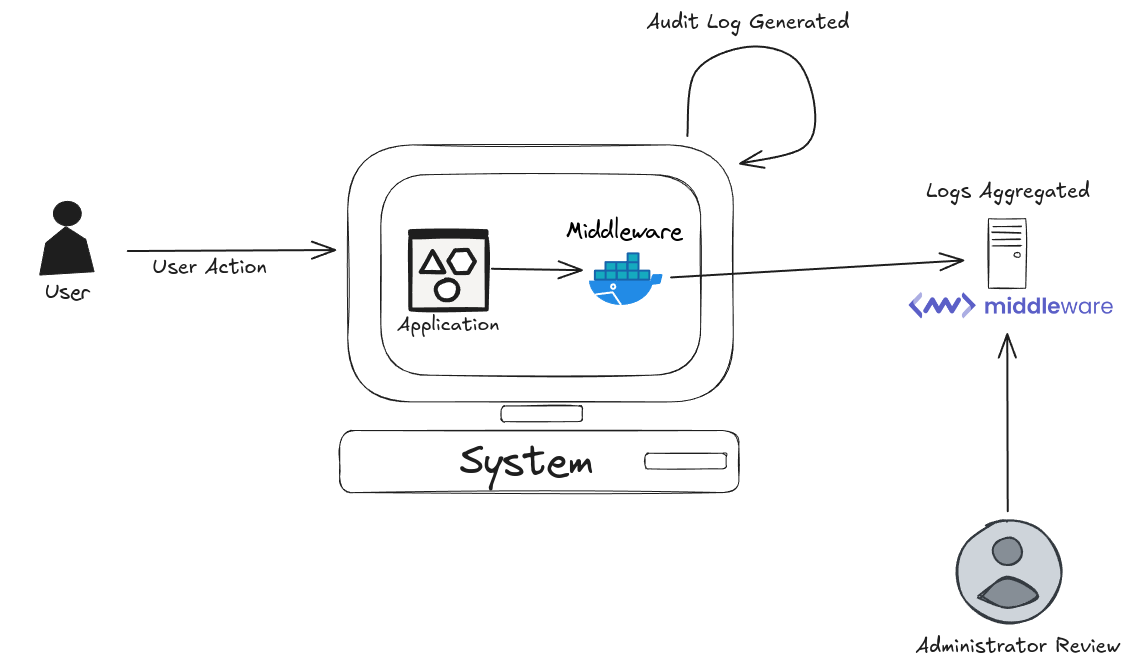
Architecture Diagram (described)
Imagine a pipeline flow:
- Left: Data Sources (databases, APIs, pipelines) generate events.
- Middle: Audit Logging Service (collectors → aggregator → immutable storage).
- Right: Analytics & Dashboards for DataOps teams and compliance officers.
Integration Points with CI/CD or Cloud Tools
- CI/CD (Jenkins, GitHub Actions, GitLab CI) → Log pipeline execution, approvals, and failures.
- Cloud Services (AWS, GCP, Azure) → Native logging like AWS CloudTrail, GCP Audit Logs, Azure Monitor integrate into DataOps.
- Data Platforms (Snowflake, Databricks, BigQuery) → Provide built-in audit logs for queries, transformations, and jobs.
4. Installation & Getting Started
Basic Setup or Prerequisites
- Access to a logging service (e.g., ELK stack, Splunk, or cloud-native logging).
- Admin privileges on your data pipeline platform.
- Storage backend for long-term retention.
Hands-On: Example Setup with ELK (Elasticsearch, Logstash, Kibana)
Step 1: Install ELK Stack
# Install Elasticsearch
sudo apt-get update
sudo apt-get install elasticsearch

# Install Logstash
sudo apt-get install logstash

# Install Kibana
sudo apt-get install kibana
Step 2: Configure Logstash to Collect Logs
input {
  file {
    path => "/var/log/dataops/audit.log"
    start_position => "beginning"
  }
}

output {
  elasticsearch {
    hosts => ["localhost:9200"]
    index => "audit-logs"
  }
}
Step 3: Start Services
sudo systemctl start elasticsearch
sudo systemctl start logstash
sudo systemctl start kibana
Step 4: View Logs in Kibana
- Navigate to
http://localhost:5601 - Create index pattern
audit-logs - Visualize queries and pipeline activity.
5. Real-World Use Cases
- Data Pipeline Monitoring
- Track when ETL jobs start, complete, or fail.
- Example: If a transformation introduces errors, logs help identify who deployed the change.
- Access & Security Compliance
- Monitor who accessed sensitive data (e.g., PII).
- Example: GDPR audits require log records showing legitimate access.
- CI/CD Pipeline Auditing
- Capture changes to production pipelines.
- Example: A GitHub Action deploying a new data schema logs the approver and executor.
- Financial Services Example
- Banks use audit logs to prove transaction transparency for regulatory authorities.
6. Benefits & Limitations
Key Advantages
- Accountability → Ensures user actions are traceable.
- Compliance → Meets legal frameworks like GDPR, HIPAA, SOX.
- Root-Cause Analysis → Faster debugging of pipeline failures.
- Trust in Data → Increases reliability of analytics outputs.
Common Challenges or Limitations
- High Storage Costs → Logs grow rapidly in DataOps environments.
- Performance Overhead → Logging too much detail may slow pipelines.
- Complexity → Requires integration with multiple systems.
- Retention Policy Conflicts → Some regulations require longer storage than is cost-effective.
7. Best Practices & Recommendations
- Security
- Encrypt logs in transit and at rest.
- Use role-based access control (RBAC).
- Performance & Maintenance
- Implement log rotation & compression.
- Use sampling when appropriate.
- Compliance Alignment
- Automate log retention according to GDPR/SOX/HIPAA.
- Maintain immutability with write-once storage.
- Automation Ideas
- Integrate with SIEM tools (Splunk, Sentinel) for real-time alerts.
- Automate compliance reports from logs.
8. Comparison with Alternatives
| Feature | Audit Logs | Monitoring (Metrics) | Tracing |
|---|---|---|---|
| Focus | Security & compliance | Performance & uptime | Request flow debugging |
| Data | Events (who, what, when) | Numeric values (CPU, memory) | Request context (spans) |
| Use Case | Compliance, accountability | System health | Root cause of request failures |
| When to Use | Regulatory needs, accountability | Performance monitoring | Debugging distributed systems |
Choose Audit Logs when:
- Compliance is required.
- Data governance and traceability are top priorities.
9. Conclusion
Audit logs are the backbone of DataOps governance, enabling trust, accountability, and compliance in automated data environments. They provide not just security but also operational intelligence, allowing teams to debug pipelines, ensure compliance, and build reliable data systems.
Future Trends
- AI-driven log analysis for anomaly detection.
- Cloud-native immutable logging with blockchain verification.
- Automated compliance-as-code using audit logs.
Next Steps
- Start with cloud-native audit logging (AWS CloudTrail, GCP Audit Logs).
- Scale with centralized logging (ELK, Splunk, Datadog).
- Automate compliance reporting.
Official Docs & Communities
- AWS CloudTrail
- GCP Audit Logs
- Azure Monitor Logs
- Elastic Stack Documentation