Introduction & Overview
Data Observability is a critical practice in modern data management, ensuring organizations can monitor, manage, and maintain the health of their data pipelines. In the context of DataOps, it serves as a foundational element to enhance data reliability, reduce downtime, and foster trust in data-driven decisions. This tutorial provides a detailed exploration of Data Observability, its integration into DataOps, practical setup guidance, real-world applications, and best practices for implementation.
What is Data Observability?
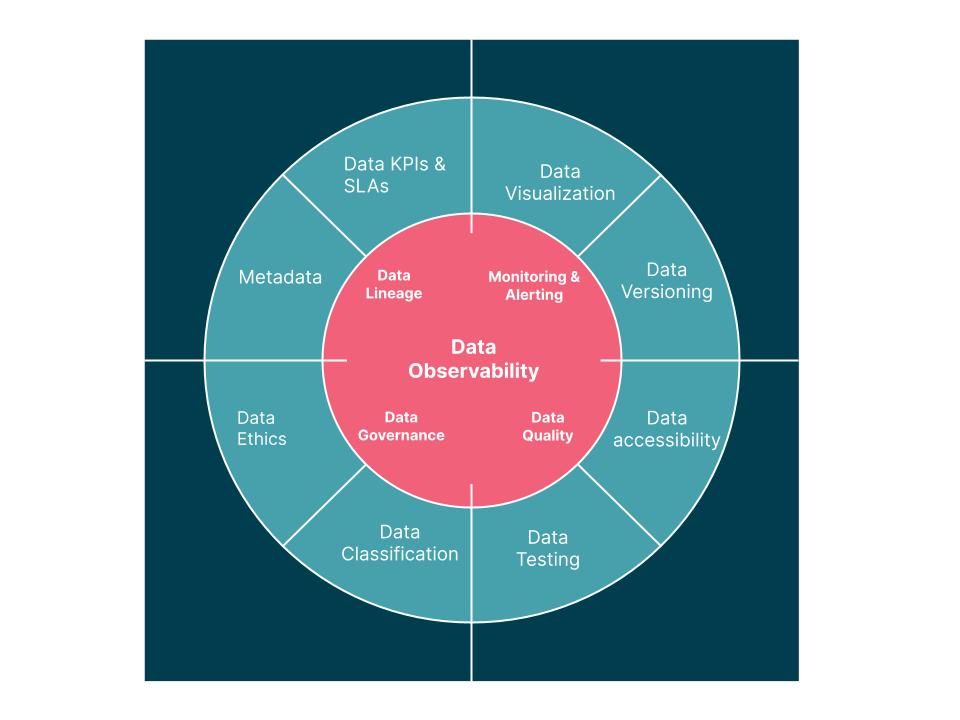
Data Observability refers to the ability to fully understand the health of data within an organization’s systems by monitoring and analyzing data pipelines to detect, diagnose, and resolve issues in real time. It goes beyond traditional data monitoring by providing deeper insights into data quality, lineage, and pipeline performance, ensuring data is accurate, fresh, and reliable.
- Definition: Data Observability is the practice of tracking and managing data health across the entire data lifecycle, using telemetry data (logs, metrics, traces) to identify anomalies and ensure data integrity.
- Scope: Covers data at rest (stored datasets) and data in motion (data flowing through pipelines).
History or Background
Data Observability emerged as an evolution of the data quality movement, drawing inspiration from DevOps observability practices. The term gained traction around 2018, with thought leaders like Barr Moses emphasizing its importance in managing complex data pipelines. As organizations adopted DataOps to streamline data operations, Data Observability became a key enabler to address the growing challenges of data volume, variety, and velocity.
- Origins: Rooted in control theory (Rudolf Kalman, 1960) and IT observability, adapted to data systems to handle the dynamic nature of modern data pipelines.
- Evolution: Driven by the rise of cloud-based data platforms, big data, and AI, which increased the need for proactive data monitoring.
Why is it Relevant in DataOps?
DataOps is a methodology that combines agile practices, automation, and collaboration to deliver reliable data pipelines. Data Observability is integral to DataOps because it ensures data reliability throughout the DataOps lifecycle, enabling faster insights, reducing data downtime, and supporting compliance with regulations like GDPR and CCPA.
- Alignment with DataOps: Enhances collaboration between data producers and consumers, reduces silos, and supports continuous improvement.
- Impact: Minimizes data downtime (periods when data is inaccurate or unavailable), which can cost businesses millions, as seen in cases like Unity Software’s $110M loss due to bad data in 2022.
- Business Value: Improves decision-making, operational efficiency, and trust in data-driven processes.
Core Concepts & Terminology
Key Terms and Definitions
- Data Observability: The ability to monitor, diagnose, and manage data health across systems, ensuring data is trustworthy and usable.
- Five Pillars of Data Observability:
- Freshness: Ensures data is up-to-date (e.g., when was the data last updated?).
- Distribution: Verifies data falls within expected ranges or formats.
- Volume: Checks if all expected data has arrived without duplication or loss.
- Schema: Monitors changes in data structure (e.g., new columns or altered schemas).
- Lineage: Tracks data’s origin, transformations, and downstream dependencies.
- Data Downtime: Periods when data is partial, erroneous, or unavailable, impacting analytics and decisions.
- Data Lineage: A map of data’s journey from source to destination, aiding in root-cause analysis.
- Metadata: Contextual information about data (e.g., timestamps, sources) used to assess quality and enable observability.
| Term | Definition | Example in DataOps |
|---|---|---|
| Data Freshness | How up-to-date the data is | Daily sales data arriving before 9 AM |
| Data Completeness | Whether all expected data is present | 100% of rows in a log file loaded |
| Data Accuracy | Whether values are correct | Correct currency conversion rates |
| Data Lineage | The history of data’s movement and transformation | Tracing customer email from CRM → ETL → Dashboard |
| Anomaly Detection | Identifying unusual data patterns | Spike in null values in a column |
| Incident Management | Tracking and resolving data quality issues | PagerDuty alert for missing datasets |
How It Fits into the DataOps Lifecycle
The DataOps lifecycle consists of iterative stages: planning, development, integration, testing, deployment, and monitoring. Data Observability supports each stage by providing visibility and actionable insights.
- Planning: Defines key metrics (e.g., data quality KPIs, SLAs) to monitor.
- Development: Validates data during pipeline creation to ensure quality.
- Integration/Testing: Uses observability tools to detect anomalies in data flows.
- Deployment: Monitors data pipelines in production to prevent downtime.
- Monitoring: Continuously tracks data health, alerting teams to issues in real time.
Architecture & How It Works
Components and Internal Workflow
Data Observability platforms typically include the following components:
- Data Collectors: Gather telemetry data (logs, metrics, traces) from pipelines and databases.
- Monitoring Engine: Analyzes data for anomalies based on predefined rules or AI/ML algorithms.
- Alerting System: Notifies teams via Slack, email, or other channels when issues are detected.
- Lineage Tracker: Maps data flows to trace issues back to their source.
- Visualization Dashboards: Provide real-time insights into data health and pipeline performance.
Workflow:
- Data Collection: Collectors extract metadata and telemetry from data sources (e.g., Snowflake, Databricks).
- Analysis: The monitoring engine evaluates data against the five pillars (freshness, volume, etc.).
- Anomaly Detection: AI/ML models or rules identify deviations (e.g., stale data, schema changes).
- Alerting and Triage: Alerts are sent to relevant teams with context for root-cause analysis.
- Resolution: Teams use lineage and dashboards to fix issues and prevent recurrence.
Architecture Diagram Description
Imagine a layered architecture:
- Bottom Layer (Data Sources): Databases (e.g., PostgreSQL), data lakes (e.g., Databricks), and cloud platforms (e.g., AWS S3).
- Middle Layer (Observability Platform): Data collectors, monitoring engine, and lineage tracker process telemetry data.
- Top Layer (User Interface): Dashboards and alerting systems provide insights and notifications.
- Connectors: APIs integrate with CI/CD tools (e.g., Jenkins) and orchestration platforms (e.g., Airflow).
[Data Sources] → [Collection Agents] → [Metrics Engine]
        ↓                 ↓
 [Lineage Tracker]   [Anomaly Detector]
        ↓                 ↓
    [Incident Alerts & Dashboard] → [Data Engineers / Analysts]
Integration Points with CI/CD or Cloud Tools
- CI/CD Integration: Observability tools like Monte Carlo integrate with GitHub for automated data quality checks during pipeline deployment.
- Cloud Tools: Seamless integration with cloud platforms (e.g., Snowflake, BigQuery) and orchestration tools (e.g., Apache Airflow) for real-time monitoring.
- APIs: REST APIs allow observability platforms to connect with existing data stacks, enabling automated workflows.
Installation & Getting Started
Basic Setup or Prerequisites
To implement Data Observability, you need:
- A data pipeline (e.g., hosted on Snowflake, Databricks, or AWS).
- Access to a Data Observability tool (e.g., Monte Carlo, DataBuck, IBM Databand).
- Administrative access to data sources and orchestration tools.
- Basic knowledge of SQL and data pipeline management.
Hands-on: Step-by-Step Beginner-Friendly Setup Guide
This guide uses Monte Carlo, a popular Data Observability platform, to set up basic monitoring for a Snowflake data pipeline.
- Sign Up for Monte Carlo:
- Visit Monte Carlo’s website and create an account.
- Obtain an API key for integration.
- Install Monte Carlo CLI:
pip install montecarlo
montecarlo configure --api-key <your-api-key>
3. Connect to Snowflake:
- Create a Snowflake service account with read access to your data warehouse.Configure Monte Carlo to connect to Snowflake:
montecarlo integrations add-snowflake \
  --account <snowflake-account> \
  --user <snowflake-user> \
  --password <snowflake-password> \
  --role <snowflake-role>
4. Set Up Monitors:
- Define freshness and volume monitors using Monte Carlo’s UI or CLI.Example CLI command to monitor table freshness:
montecarlo monitors create \
  --table <database.schema.table> \
  --type freshness \
  --threshold-hours 24
5. Configure Alerts:
- Set up Slack notifications for anomalies:
montecarlo notifications add-slack \
  --webhook-url <slack-webhook-url>
6. View Dashboards:
- Log in to Monte Carlo’s web interface to view data health dashboards and lineage maps.
7. Test the Setup:
- Simulate a data issue (e.g., stop a pipeline) and verify that Monte Carlo detects and alerts you.
Real-World Use Cases
- E-commerce: Ensuring Fresh Sales Data:
- Scenario: An e-commerce company uses Data Observability to monitor sales data pipelines in real time.
- Application: Monte Carlo detects a freshness issue when a daily sales report isn’t updated due to a pipeline failure, alerting the DataOps team to resolve it within minutes.
- Impact: Prevents inaccurate sales forecasts, saving potential revenue losses.
- Finance: Regulatory Compliance:
- Healthcare: Real-Time Patient Data:
- Scenario: A hospital uses observability to ensure patient data is accurate for analytics.
- Application: DataBuck’s AI-driven anomaly detection identifies missing patient records in a pipeline, enabling quick fixes.
- Impact: Improves patient care by ensuring reliable data for decision-making.
- Media: Dashboard Integrity:
Benefits & Limitations
Key Advantages
- Reduced Data Downtime: Detects issues early, minimizing disruptions.
- Improved Trust: Ensures data is fresh, accurate, and reliable for decision-making.
- Faster Root-Cause Analysis: Lineage and telemetry data pinpoint issues quickly.
- Compliance Support: Tracks data usage to meet regulatory requirements (e.g., GDPR, CCPA).
Common Challenges or Limitations
- Complexity: Setting up observability for complex pipelines can be time-consuming.
- Cost: Advanced tools like Monte Carlo may have high licensing fees.
- Learning Curve: Requires training to interpret telemetry data and configure monitors.
- Tool Dependency: Some tools may not support all data sources or require custom integrations.
Best Practices & Recommendations
- Security Tips:
- Use role-based access control (RBAC) to limit access to observability data.
- Encrypt telemetry data in transit and at rest.
- Performance:
- Maintenance:
- Regularly update monitoring rules to reflect schema changes.
- Review lineage maps to ensure accuracy as pipelines evolve.
- Compliance Alignment:
- Map observability metrics to compliance requirements (e.g., GDPR’s data tracking needs).
- Document lineage for audit purposes.
- Automation Ideas:
- Integrate with CI/CD pipelines to automate data quality checks.
- Use APIs to trigger automated remediation workflows.
Comparison with Alternatives
| Feature | Data Observability | Traditional Monitoring | Data Quality Tools |
|---|---|---|---|
| Scope | Holistic (pipeline + data health) | Pipeline performance only | Data validation only |
| Pillars Covered | Freshness, volume, schema, lineage, distribution | Metrics, logs, traces | Schema, row-level checks |
| Proactive Detection | Yes (AI/ML-driven) | Limited (rule-based) | Limited (rule-based) |
| Lineage Tracking | Comprehensive | Partial or none | None or limited |
| Integration with DataOps | High (CI/CD, cloud) | Moderate | Low |
| Example Tools | Monte Carlo, IBM Databand | Datadog, Splunk | Great Expectations |
When to Choose Data Observability:
- Use when managing complex, multi-source data pipelines.
- Ideal for organizations prioritizing real-time insights and compliance.
- Choose alternatives like Great Expectations for simple, rule-based data quality checks.
Conclusion
Data Observability is a cornerstone of effective DataOps, enabling organizations to maintain reliable, high-quality data pipelines. By leveraging the five pillars—freshness, distribution, volume, schema, and lineage—teams can reduce data downtime, improve trust, and support data-driven decisions. As data volumes grow and AI adoption increases, observability will become even more critical, especially for unstructured data and generative AI pipelines.
Next Steps:
- Explore tools like Monte Carlo, IBM Databand, or DataBuck.
- Start with a pilot project to monitor a critical pipeline.
- Join communities like DataOps.live or O’Reilly’s data observability courses.