Introduction & Overview
✅ What is a Data Pipeline?
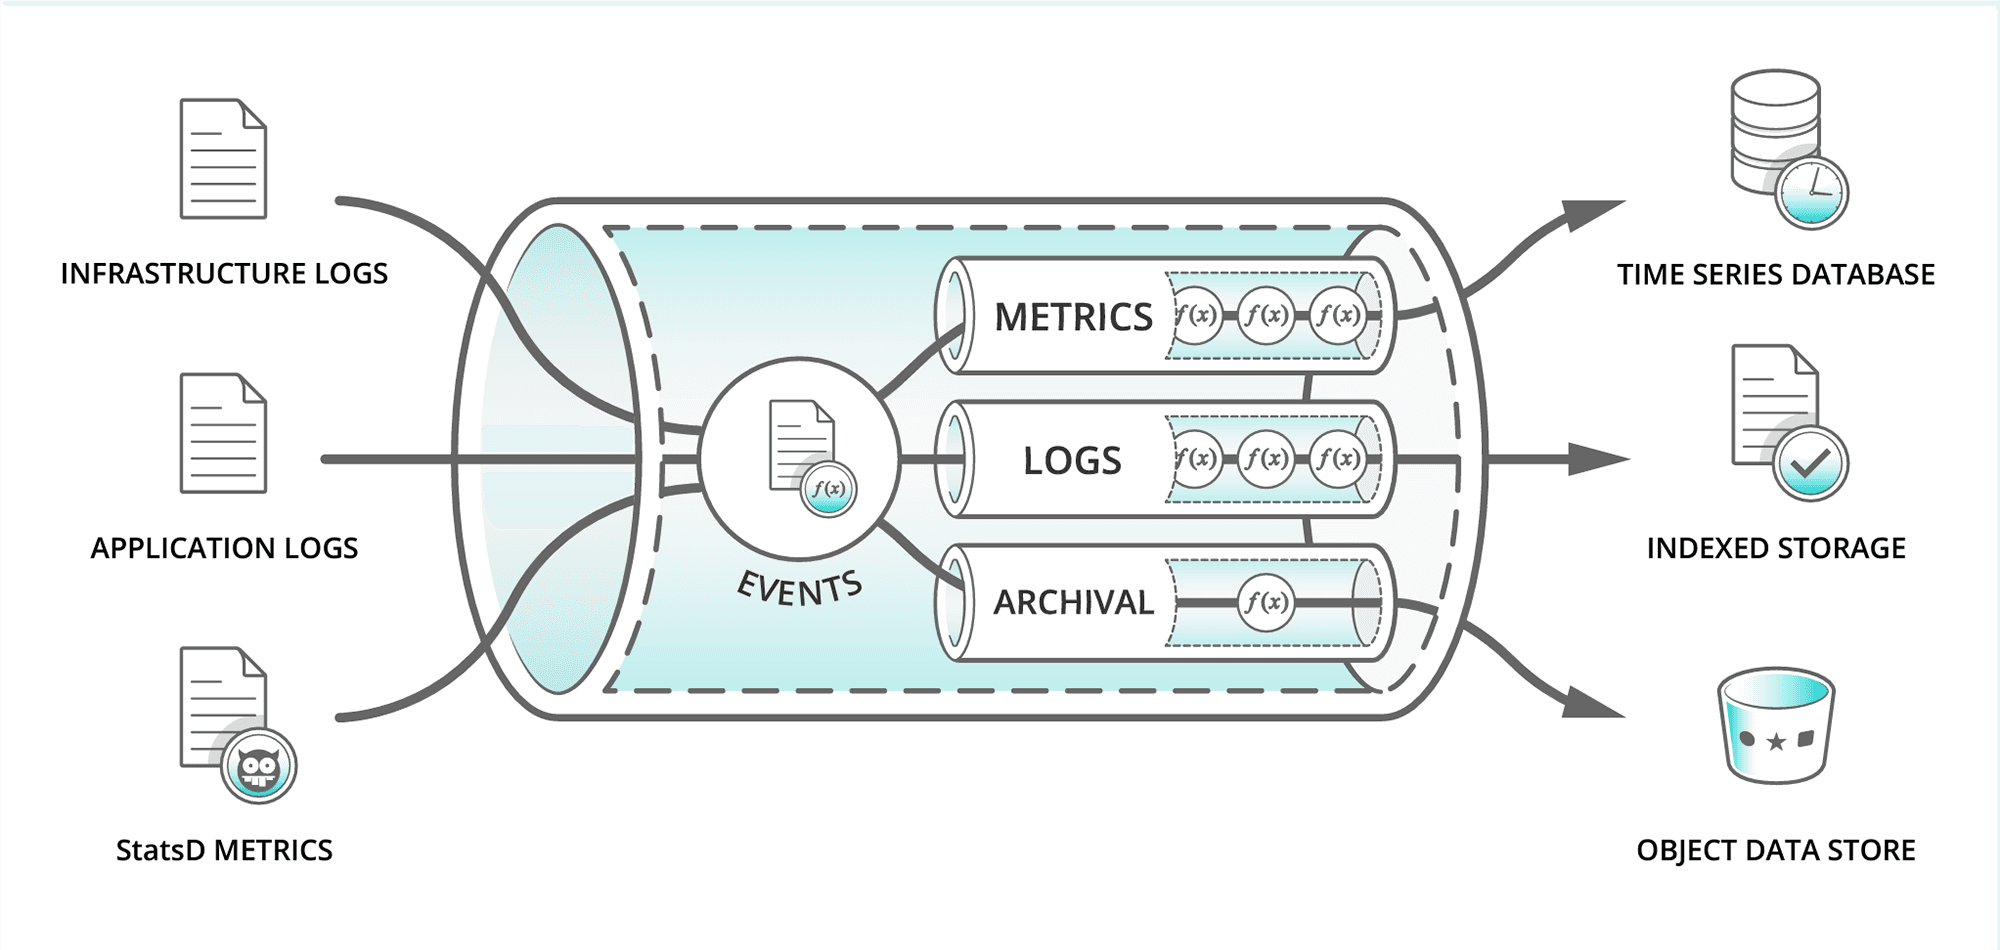
A Data Pipeline is a set of automated processes that extract data from various sources, transform it into a usable format, and load it into a storage or analytical system—often referred to as ETL (Extract, Transform, Load).
In the context of DevSecOps, data pipelines are essential for:
- Aggregating logs and metrics
- Running continuous security analysis
- Feeding threat intelligence systems
- Automating compliance audits
🕰️ History & Background
| Year | Milestone |
|---|---|
| 2000s | Basic ETL tools like Talend and Informatica dominated data workflows |
| 2010s | Rise of Big Data (Hadoop, Spark), cloud data services |
| 2014 | DevSecOps introduced to merge security into DevOps |
| 2016+ | Data pipelines evolved to support real-time, scalable, secure pipelines with CI/CD integrations |
| 2020s | Emergence of modern pipeline tools like Apache Airflow, AWS Data Pipeline, Dagster, and cloud-native data lakes |
🎯 Why It’s Relevant in DevSecOps
- Ensures secure, real-time flow of logs, metrics, and telemetry
- Enables automated security checks on production data
- Facilitates continuous compliance monitoring (e.g., GDPR, HIPAA)
- Helps DevSecOps teams track changes, detect anomalies, and respond quickly
🔑 Core Concepts & Terminology
🔤 Key Terms & Definitions
| Term | Definition |
|---|---|
| ETL | Extract, Transform, Load – traditional data pipeline pattern |
| Streaming | Real-time data processing (e.g., Kafka, Spark Streaming) |
| Batch Processing | Scheduled or periodic data movement and processing |
| Data Lake | A centralized repository for storing raw data |
| Orchestration | Managing and scheduling tasks (e.g., Airflow DAGs) |
| Data Governance | Policies and processes to manage data privacy and quality |
| Data Lineage | Tracking the flow and transformation of data |
| Immutable Logs | Logs that cannot be altered – critical for security audits |
| CI/CD | Continuous Integration / Continuous Deployment – DevOps practice |
🔄 Fit in DevSecOps Lifecycle
| Stage | Role of Data Pipeline |
|---|---|
| Plan | Collect metrics from past builds to improve planning |
| Develop | Stream developer logs or test metrics into analysis tools |
| Build/Test | Feed test results into dashboards and vulnerability scanners |
| Release | Track change requests and deployment events |
| Deploy | Aggregate audit logs and access data |
| Operate | Collect system telemetry and application logs |
| Monitor | Analyze security incidents, performance data in real-time |
🏗️ Architecture & How It Works
🧩 Components of a Secure Data Pipeline
- Data Sources (logs, databases, APIs)
- Ingestion Layer (Fluentd, Filebeat, Kafka)
- Processing Layer (Apache Spark, AWS Glue, Dagster)
- Storage Layer (S3, Data Lakes, Elasticsearch, PostgreSQL)
- Analytics/Monitoring (Grafana, Kibana, Prometheus)
- Security Layer (encryption, IAM, audit logs)
- Orchestration/Automation (Airflow, Prefect, Jenkins)
🔁 Internal Workflow
- Ingest: Collect security-related logs, vulnerabilities, events.
- Normalize: Format data (JSON, Parquet, etc.) for consistency.
- Enrich: Add threat intelligence, geo-location, asset metadata.
- Store: Save in data lakes or searchable databases.
- Analyze & Alert: Detect anomalies or compliance violations.
# Sample: Extract logs, transform, then load to ElasticSearch
filebeat -> logstash (filter: remove IP) -> elasticsearch -> kibana
🏗️ Architecture Diagram (Text Description)
[Data Sources] --> [Ingestion Layer] --> [Processing Layer] --> [Storage] --> [Security & Audit] -->  [Dashboards / Alerts]
                                 (e.g., Kafka)                  (e.g., Spark)               (e.g., S3)            (IAM, Vault)         (Grafana/Kibana)
⚙️ Integration Points
| Tool | Role in Data Pipeline |
|---|---|
| GitHub/GitLab | Code metadata and commit hooks |
| Jenkins | CI build and test results |
| SonarQube | Static analysis results |
| AWS CloudWatch | Infrastructure monitoring |
| Prometheus | App and infra telemetry |
| SIEM (e.g., Splunk) | Log aggregation and threat detection |
CI Tools: Jenkins, GitHub Actions – trigger data jobs post-build
Cloud: AWS Data Pipeline, Azure Data Factory, GCP Dataflow
Security: Integrate with tools like Snyk, Aqua Security, HashiCorp Vault
🚀 Installation & Getting Started
📋 Prerequisites
- Docker & Kubernetes (for orchestration)
- Access to GitHub/GitLab CI/CD
- Cloud storage (e.g., AWS S3 or GCS)
- Python/Java runtime
- Basic YAML and JSON knowledge
Python (3.8+)
Docker (for isolated pipelines)
Cloud CLI (AWS/GCP/Azure)
Basic knowledge of logs, shell scripting
👣 💻 Hands-on Setup: Apache Airflow with Docker
Step 1: Clone Airflow Docker Repo
bashCopyEditgit clone https://github.com/apache/airflow.git
cd airflow
Step 2: Start Airflow with Docker Compose
bashCopyEditdocker-compose up airflow-init
docker-compose up
Step 3: Access UI
- Visit
http://localhost:8080 - Default creds:
admin / admin
Step 4: Define a Simple DAG
from airflow import DAG
from airflow.operators.bash import BashOperator
from datetime import datetime

with DAG('simple_pipeline', start_date=datetime(2023, 1, 1), schedule_interval='@daily') as dag:
    task = BashOperator(
        task_id='print_date',
        bash_command='date'
    )
🧪 Real-World Use Cases
1. 🔍 Security Monitoring Pipeline
- Collects real-time security logs (e.g., from AWS GuardDuty)
- Sends them to Elasticsearch for alerting
- Visualized using Kibana dashboards
2. 📜 Compliance Auditing
- Automates extraction of audit logs from cloud services
- Runs compliance rules (e.g., CIS Benchmark)
- Flags violations for action
3. 🧪 Continuous Testing Feedback
- Streams test results from CI/CD builds
- Transforms data into analytics reports
- Tracks test coverage over time
4. 🏥 Healthcare (HIPAA)
- Encrypts patient log data during transit
- Tracks access logs to maintain compliance
- Alerts unauthorized access patterns
🎯 Benefits & Limitations
✅ Key Advantages
- Automation: Eliminates manual data movement
- Scalability: Handles massive data volumes securely
- Real-Time: Enables faster response to threats
- Compliance: Supports regulatory mandates
❌ Common Challenges
- Complexity: Integration with DevSecOps tools can be tough
- Latency: Some tools add processing delays
- Security Risks: Poorly protected pipelines can leak sensitive data
- Data Quality: Unvalidated data can cause false positives
🛡️ Best Practices & Recommendations
🔐 Security Best Practices
- Encrypt data in transit and at rest (TLS, KMS)
- Use IAM roles or service accounts for access control
- Regularly rotate secrets and tokens (Vault, AWS Secrets Manager)
⚙️ Performance & Automation
- Use DAG parallelism for faster execution
- Add retry mechanisms and alerts for failed jobs
- Automate testing of pipelines via CI/CD
✅ Compliance Alignment
- Maintain audit trails
- Map pipelines to compliance controls (e.g., SOC 2, ISO 27001)
- Anonymize or mask PII data in transit
🔁 Comparison with Alternatives
| Feature/Tool | Airflow | AWS Data Pipeline | Dagster | Logstash/Filebeat |
|---|---|---|---|---|
| Type | Orchestration | Cloud-native ETL | Modern ETL | Log ingestion |
| DevSecOps Fit | Excellent | Strong (AWS only) | Great | Great for logging |
| Real-Time Support | Partial | No | Partial | Yes |
| Security Features | Customizable | AWS IAM, KMS | Built-in | TLS, File-based |
When to Choose Data Pipelines
- Choose Airflow for custom, complex DevSecOps pipelines
- Choose Filebeat/Logstash for log-based security monitoring
- Choose AWS Data Pipeline for native AWS integrations
🏁 Conclusion
🧠 Final Thoughts
Data pipelines are foundational to DevSecOps success—enabling automation, observability, and compliance in real-time. By integrating data pipelines into CI/CD workflows and securing every stage of the data journey, organizations can proactively respond to threats and maintain visibility across the software lifecycle.