1. Introduction & Overview

What is Looker?
Looker is a modern data platform that enables organizations to explore, analyze, and share real-time business insights. It provides a web-based interface for data visualization, reporting, and dashboards, built on top of SQL and BigQuery-compatible engines.

Originally developed as a Business Intelligence (BI) tool, Looker has evolved into a data operations platform useful for monitoring, observability, and compliance — all of which are crucial to DevSecOps.
History and Background
- Founded: 2012 by Lloyd Tabb and Ben Porterfield.
- Acquisition: Acquired by Google in 2019 for $2.6 billion.
- Current Offering: Part of the Google Cloud Platform (GCP) as Looker Studio.
Why is Looker Relevant in DevSecOps?
DevSecOps integrates development, security, and operations. Looker supports this ecosystem by:
- Enabling real-time dashboards to monitor security metrics, vulnerabilities, and compliance.
- Serving as a data source aggregator for cloud logs, security scans, and CI/CD pipelines.
- Providing customizable alerts and visualizations to support decision-making in secure software delivery.
2. Core Concepts & Terminology
Key Terms
| Term | Description |
|---|---|
| LookML | A modeling language used in Looker to describe dimensions, measures, and relationships in data. |
| Explore | A user interface to query modeled data without writing SQL. |
| Dashboard | A collection of visualizations and charts providing insights into your data. |
| Look | A saved visualization/report in Looker. |
| Model | A collection of views and explores defining data structure. |
How It Fits into the DevSecOps Lifecycle
| DevSecOps Phase | Looker Use Case |
|---|---|
| Plan | Risk dashboards for planning secure features. |
| Develop | Code scanning metrics from tools like SonarQube, GitHub. |
| Build/Test | Visualization of SAST/DAST results. |
| Release | Compliance metrics before deployments. |
| Operate | Real-time cloud logs, uptime, incident dashboards. |
| Monitor | Continuous monitoring of anomalies or threat indicators. |
3. Architecture & How It Works
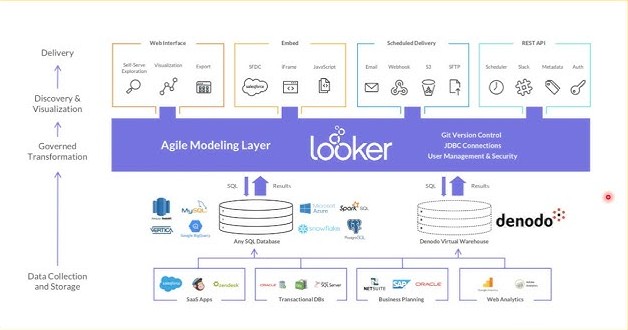
Components of Looker Architecture
- Looker Web App – Front-end GUI for users and developers.
- Looker Model Layer (LookML) – Abstraction layer to define how data is queried.
- SQL Database/Cloud Warehouse – Backend data source (BigQuery, Snowflake, Redshift, etc.).
- API & SDK – Integration with CI/CD tools and data platforms.
- Scheduler & Alerts – Automate reporting and alerts on thresholds.
Internal Workflow
Data Source (e.g., BigQuery, Snowflake)
       |
   [LookML Model]
       |
   [Explores] -> [Looks] -> [Dashboards] -> [Alerts, Shares, Embeds]
Architecture Diagram (Descriptive)
+--------------------------+
|    User Interface        |
|  - Dashboards/Reports    |
|  - Explores/Filters      |
+-----------+--------------+
            |
+-----------v--------------+
|    Looker Web Server     |
|  - Auth, Permissions     |
|  - Query Generation      |
+-----------+--------------+
            |
+-----------v--------------+
|       LookML Layer       |
|  - Models, Views         |
|  - SQL Abstractions      |
+-----------+--------------+
            |
+-----------v--------------+
|     Data Warehouse       |
| (BigQuery / Redshift /   |
|  Snowflake / PostgreSQL) |
+--------------------------+
Integration Points with CI/CD or Cloud
- Jenkins/GitHub Actions → Push metrics to Looker DB (e.g., test results).
- Security Tools (Snyk, Twistlock, AquaSec) → Feed scan results to Looker.
- Cloud Platforms (GCP, AWS) → Integrate logs via BigQuery or CloudWatch.
4. Installation & Getting Started
Prerequisites
- A cloud data warehouse (e.g., BigQuery).
- A Looker account (GCP or legacy).
- Admin permissions to connect and model data sources.
- Basic SQL knowledge for LookML modeling.
Step-by-Step Beginner Setup
- Sign Up for Looker via https://lookerstudio.google.com
- Connect to a Data Source:
- Go to Admin > Connections
- Choose your data warehouse (e.g., BigQuery)
- Provide credentials and test connection
- Create a Model Project:
- Navigate to Develop > Manage LookML ProjectsCreate a new model and define views
view: pipeline_security {
  dimension: repo {
    type: string
    sql: ${TABLE}.repository ;;
  }
  measure: total_issues {
    type: count
  }
}
4. Build Explores and Dashboards:
- Use “Explore” to query modeled data
- Create dashboards with filters, charts, and alerts
5. Schedule Reports/Alerts:
- Share dashboards with security teams
- Set up email/slack alerts for threshold breaches
5. Real-World Use Cases
📌 Use Case 1: Security Metrics Dashboard
- Track vulnerabilities from Snyk scans.
- Visualize open vs. resolved issues per repository.
📌 Use Case 2: Compliance Monitoring
- Monitor GDPR, HIPAA compliance checkpoints.
- Use Looker to alert when logs or user access events breach thresholds.
📌 Use Case 3: CI/CD Pipeline Insights
- Monitor deployment frequency, failed builds.
- Correlate test coverage data with security issues.
📌 Use Case 4: Cloud Cost + Security
- Combine GCP billing data with security posture.
- Track which teams are generating non-compliant resources.
6. Benefits & Limitations
✅ Key Benefits
- Unified View: Central dashboard for DevSecOps insights.
- Custom Models: Tailored data logic using LookML.
- Real-Time Monitoring: Timely decision-making.
- Cloud Native: Seamless GCP integration.
❌ Limitations
| Limitation | Description |
|---|---|
| Cost | Looker can be expensive for large-scale enterprise use. |
| Complexity | Requires understanding of LookML and SQL. |
| Latency | Query performance depends on warehouse performance. |
| Vendor Lock-In | Heavily integrated into GCP ecosystem. |
7. Best Practices & Recommendations
Security & Compliance
- Restrict data access via row-level security.
- Use OAuth & SSO for authentication.
- Store PII-compliant dashboards separately.
Performance
- Optimize LookML models with explore joins.
- Limit data scopes using filters and caching.
Automation & Maintenance
- Use Looker API to:
- Auto-refresh dashboards
- Integrate with Terraform or GitOps
- Document LookML projects via version control.
8. Comparison with Alternatives
| Tool | Looker | Grafana | Tableau | Power BI |
|---|---|---|---|---|
| Best For | Data Modeling + BI | Infra Monitoring | Drag-n-drop BI | MS Ecosystem |
| LookML | ✅ Yes | ❌ No | ❌ No | ❌ No |
| Alerts | ✅ Yes | ✅ Yes | ✅ Yes | ✅ Yes |
| Security | ✅ (RBAC, OAuth) | ❌ Basic | ✅ Basic | ✅ Azure AD |
| Cloud Native | ✅ (GCP) | ✅ (Prometheus) | ❌ | ✅ Azure |
When to Choose Looker:
- You need custom data models, secure dashboards, and DevSecOps integration.
- You’re operating within Google Cloud environments.
9. Conclusion
Looker is not just a BI tool — it’s a strategic data partner in the DevSecOps pipeline. From compliance monitoring to security visualizations, Looker empowers teams with actionable insights, real-time alerts, and customized dashboards. While it has a learning curve and cost considerations, its scalability and depth of integration make it a valuable tool in modern cloud-native DevSecOps environments.