1. Introduction & Overview
What is Power BI?
Power BI is Microsoft’s suite of business intelligence (BI) tools for data visualization, analytics, and reporting. It enables users to transform raw data into informative dashboards and reports through interactive and customizable visualizations.
History or Background
- Introduced in 2013 as part of Office 365 under the “Power” suite (with Power Query and Power Pivot).
- Gradually evolved into a full-fledged cloud-based BI solution.
- Integrates tightly with Microsoft’s Azure ecosystem, making it a strategic fit for cloud-native DevSecOps workflows.
Why is It Relevant in DevSecOps?
In DevSecOps, observability and actionable insight are paramount. Power BI supports:
- Visualization of security metrics, code scan results, incident trends.
- Integration with CI/CD pipelines to analyze deployment frequency, failed builds, or compliance violations.
- Real-time dashboards to monitor vulnerability trends across environments.
2. Core Concepts & Terminology
Key Terms and Definitions
| Term | Description |
|---|---|
| Dataset | A collection of data imported or connected from a source (e.g., Azure DevOps, GitHub, AWS). |
| Report | A multi-page layout of visuals and metrics based on a dataset. |
| Dashboard | A single-page summary of visuals from multiple reports. |
| Data Gateway | A bridge to securely connect on-premise data with Power BI cloud services. |
| Power BI Service | Cloud-based SaaS platform for sharing and collaborating on BI content. |
| Power BI Desktop | Windows application for creating and publishing Power BI reports. |
How It Fits Into the DevSecOps Lifecycle
| DevSecOps Phase | Power BI Integration |
|---|---|
| Plan | Visualize threat modeling, compliance audits. |
| Develop | Monitor secret detection, code quality scores. |
| Build | Analyze build scan results, SBOM metrics. |
| Test | Visualize test coverage, security testing outcomes. |
| Release | Report on release approvals and policy enforcement. |
| Deploy | Correlate deployment trends with security findings. |
| Operate/Monitor | Continuous observability of runtime risks, incidents. |
3. Architecture & How It Works
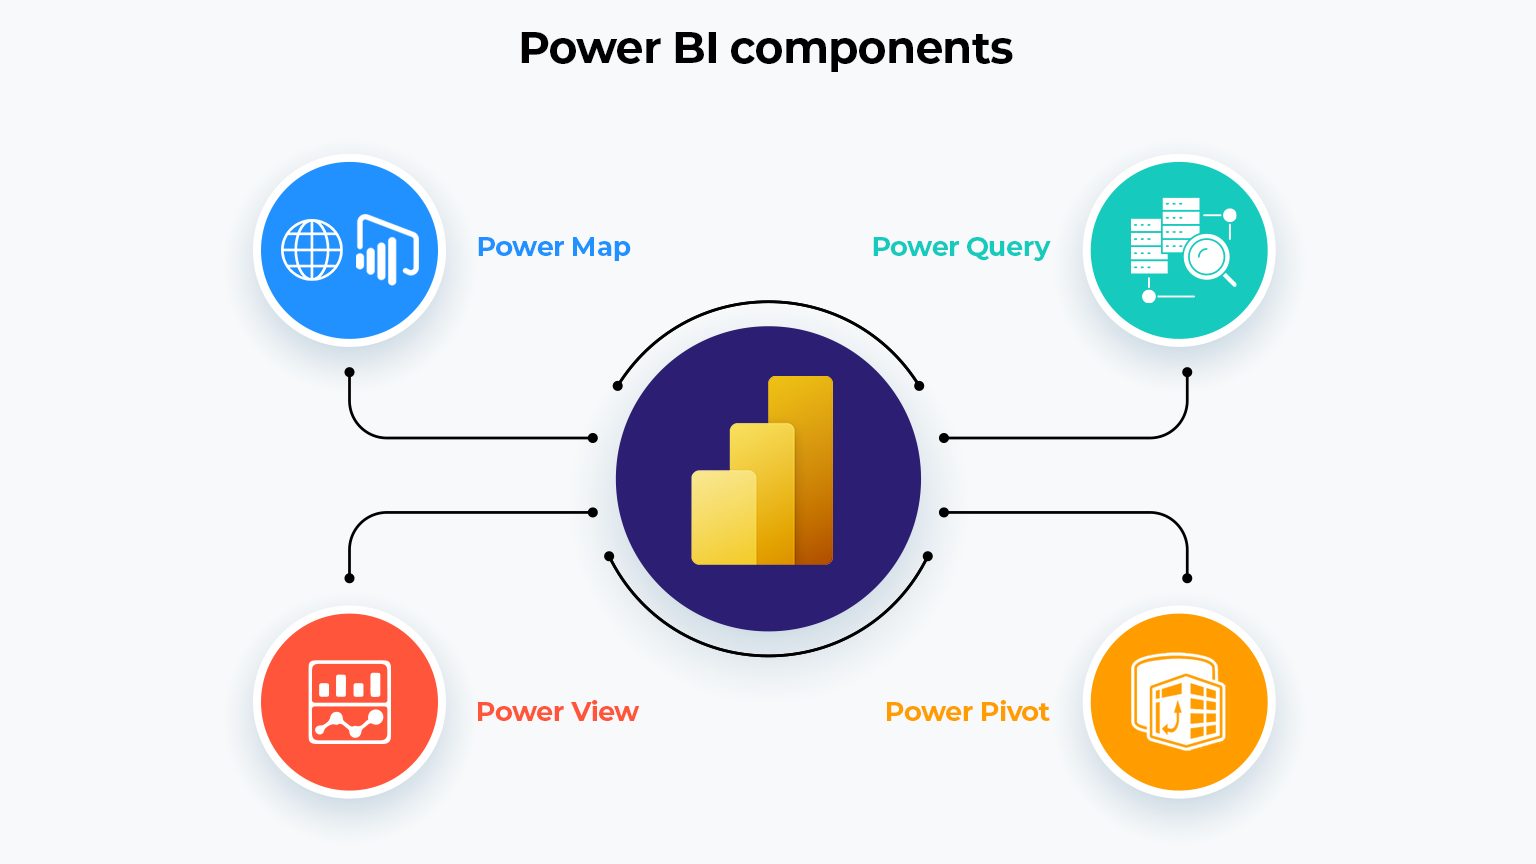
Components
- Power BI Desktop – Authoring tool for reports.
- Power BI Service (Cloud) – Sharing, scheduling, publishing.
- Power BI Gateway – Securely connects cloud with on-prem data sources.
- Data Sources – Includes Azure DevOps, SQL databases, GitHub APIs, SIEM tools.
Internal Workflow
- Connect to data source (e.g., Azure DevOps API).
- Model and transform data using Power Query.
- Create reports in Power BI Desktop.
- Publish to Power BI Service.
- Set up refresh schedules and user roles.
- Share dashboards with stakeholders.
Architecture Diagram (Descriptive)
Architecture Flow:
DevSecOps Tools (Azure DevOps, GitHub, SonarQube, etc.)
          ↓
Power BI Data Gateway (optional for on-prem)
          ↓
Power BI Desktop (Model + Visualize)
          ↓
Power BI Service (Publish + Share + Automate)
          ↓
Dashboards and Reports for Security, Compliance, Performance

Integration Points with CI/CD or Cloud Tools
| Tool | Integration Method |
|---|---|
| Azure DevOps | Built-in connector for work items, pipelines, test plans |
| GitHub | REST API or Power BI custom connector |
| AWS | Connect via AWS Athena, RDS, or custom REST APIs |
| Kubernetes | Use Prometheus/Grafana exporters with SQL or REST APIs |
| Security Tools (e.g., SonarQube, Snyk) | REST API connectors or CSV export ingestion |
4. Installation & Getting Started
Basic Setup or Prerequisites
- Windows system with Power BI Desktop.
- Power BI account (Free for personal, Pro for sharing).
- Access to your DevSecOps tool’s API or export format.
- Optional: On-prem gateway setup if connecting to local resources.
Hands-on: Step-by-Step Beginner Setup
1. Download and Install
# Download Power BI Desktop
https://powerbi.microsoft.com/desktop/
2. Connect to Azure DevOps
- Open Power BI Desktop → Get Data → Azure DevOps (Beta) or Web API.
- Provide personal access token (PAT).
- Choose your dataset (e.g., Work Items, Builds).
3. Transform Data
- Use Power Query Editor to clean and shape the data.
- Remove nulls
- Rename fields
- Merge multiple sources
4. Build Visuals
- Drag fields into the canvas to create charts like:
- Failed Builds vs. Successful Builds
- OWASP vulnerabilities by severity
- Lead time for changes
5. Publish Report
- Save and Publish → Power BI Service.
- Set refresh schedule (e.g., every 6 hours).
- Share dashboards with DevSecOps team.
5. Real-World Use Cases
1. Vulnerability Tracking Dashboard
- Integrate Power BI with Snyk or Dependabot.
- Visualize CVEs over time.
- Track unresolved vs. resolved vulnerabilities.
2. Secure Deployment Monitoring
- Connect to CI/CD tools (GitHub Actions, Azure Pipelines).
- Show failed pipeline jobs due to security scans.
- Analyze deployment frequency by environment.
3. Code Quality & Secrets Detection
- Import SonarQube metrics and Gitleaks results.
- Show code smells, security hotspots, and leaked keys.
- Align reports with software releases.
4. Compliance Audit Visualization
- Combine Azure Policy compliance and access logs.
- Display percentage of compliant resources.
- Highlight non-conforming deployments per region.
6. Benefits & Limitations
Key Advantages
- Rich Visuals – Intuitive dashboards for non-technical stakeholders.
- Cloud Native – Seamless Azure integration.
- Secure Sharing – Role-based access control.
- Automation Friendly – Data refresh and API integrations.
Common Challenges
- Latency – Data refresh isn’t real-time unless integrated with streaming datasets.
- Complex Transformations – Requires strong Power Query/DAX knowledge.
- Cost – Pro and Premium tiers can add cost for enterprise-wide usage.
- Limited Alerting – Compared to tools like Grafana, alerting is less advanced.
7. Best Practices & Recommendations
Security Tips
- Use Row-Level Security (RLS) to restrict data access by roles.
- Secure data sources with Azure Active Directory.
- Avoid storing secrets or tokens directly in Power BI.
Performance Tips
- Optimize queries before import.
- Use star schema modeling.
- Minimize visual count per page.
Compliance Alignment
- Map Power BI dashboards to standards like NIST, ISO 27001, or CIS Controls.
- Ensure audit trails via Power BI activity logs.
Automation Ideas
- Embed dashboards in developer portals.
- Auto-refresh dashboards after each CI/CD run.
- Trigger Power Automate flows on data changes.
8. Comparison with Alternatives
| Feature | Power BI | Grafana | Tableau | Kibana |
|---|---|---|---|---|
| Best For | Enterprise BI | Monitoring & alerting | Advanced visuals | Log analysis |
| Security Visuals | ✅ | ⚠️ (plugin dependent) | ✅ | ✅ |
| CI/CD Integration | ✅ | ✅ | ⚠️ | ⚠️ |
| Ease of Use | High | Medium | Medium | Low |
| Alerting | Limited | Advanced | Limited | Advanced |
When to Choose Power BI
- You are already in the Microsoft/Azure ecosystem.
- You need rich visuals for executives and compliance teams.
- Your team values collaborative, self-service BI.
9. Conclusion
Power BI brings powerful business intelligence to the DevSecOps pipeline. It enables teams to make data-driven decisions on security, operations, and development by providing real-time insights from disparate sources. With integrations across Azure, GitHub, and security tools, Power BI empowers both technical and non-technical stakeholders to visualize and act on metrics that matter.
Future Trends
- Integration with AI-driven anomaly detection.
- More real-time data ingestion capabilities.
- Deeper GitHub Copilot or Microsoft Security Copilot integration.
Next Steps
- Explore Power BI DevSecOps templates on GitHub.
- Experiment with APIs from your CI/CD and security tools.
- Set up a centralized observability dashboard.
Category: