Introduction & Overview
What is Data Anomaly Detection?
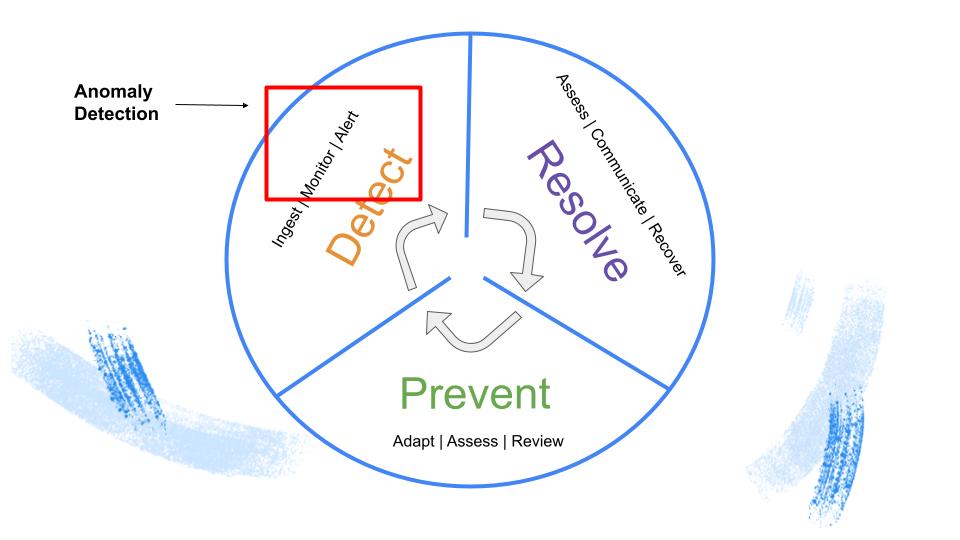
Data anomaly detection is the process of identifying patterns or data points that deviate significantly from expected behavior in datasets. These anomalies, often referred to as outliers, can indicate errors, fraud, or significant events requiring attention. In DataOps, anomaly detection ensures data quality, reliability, and trustworthiness across the data pipeline by flagging irregularities in real-time or batch processes.
History or Background
Anomaly detection traces its origins to statistical quality control in the early 20th century, with pioneers like Walter Shewhart using control charts to monitor industrial processes. The field advanced significantly in the 2000s with the rise of machine learning, enabling techniques like clustering, neural networks, and ensemble methods to handle large-scale, complex data. In DataOps, anomaly detection gained prominence as organizations adopted automated data pipelines and big data technologies, necessitating robust mechanisms to ensure data integrity and operational efficiency.
Why is it Relevant in DataOps?
DataOps emphasizes automation, collaboration, and agility in data management to deliver high-quality data for analytics and decision-making. Anomaly detection is critical in this context because it:
- Ensures data quality by identifying inconsistencies early in the pipeline.
- Supports automated workflows by detecting issues before they propagate to downstream processes.
- Enhances trust in data-driven decisions, critical for industries like finance, healthcare, and e-commerce.
- Enables proactive monitoring in real-time, aligning with DataOps’ focus on continuous improvement.
Core Concepts & Terminology
Key Terms and Definitions
- Anomaly: A data point or pattern that deviates significantly from the norm, such as an unusual transaction or sensor reading.
- Outlier Detection: The process of identifying data points outside expected statistical or behavioral boundaries.
- Unsupervised Learning: A common approach for anomaly detection when labeled data is unavailable, using algorithms like Isolation Forest or Autoencoders.
- Data Drift: Gradual changes in data distribution that can affect model performance, often requiring anomaly detection to identify.
- Thresholding: Setting boundaries (e.g., Z-scores or confidence intervals) to classify data as normal or anomalous.
| DataOps Stage | Role of Anomaly Detection |
|---|---|
| Data Ingestion | Detect missing files, corrupted records |
| Data Transformation | Spot incorrect joins, invalid schema mappings |
| Data Validation | Identify duplicates, null spikes, out-of-range values |
| ML/Analytics | Detect data drift impacting model accuracy |
| Data Delivery | Ensure trustworthy data for BI dashboards |
How It Fits into the DataOps Lifecycle
The DataOps lifecycle includes stages like data ingestion, transformation, modeling, and deployment. Anomaly detection integrates at multiple points:
- Ingestion: Validates incoming data for errors, such as missing values or outliers in streaming data.
- Transformation: Monitors data quality during ETL (Extract, Transform, Load) processes to ensure consistency.
- Modeling: Ensures training datasets are free of anomalies that could skew machine learning models.
- Deployment: Detects anomalies in production data, enabling real-time alerts for issues like fraud or system failures.
Architecture & How It Works
Components and Internal Workflow
An anomaly detection system in DataOps typically includes:
- Data Input Layer: Collects data from sources like databases, APIs, or streaming platforms (e.g., Kafka).
- Preprocessing Module: Cleans and normalizes data, handling missing values, scaling features, or encoding categorical variables.
- Detection Algorithm: Applies statistical (e.g., Z-score), machine learning (e.g., Isolation Forest), or deep learning (e.g., Autoencoders) methods to identify anomalies.
- Alerting System: Notifies stakeholders via dashboards (e.g., Grafana) or APIs when anomalies are detected.
- Feedback Loop: Incorporates human or automated feedback to refine detection models and reduce false positives.
Architecture Diagram Description
The architecture can be described as a sequential pipeline:
- Data flows from sources (e.g., SQL databases, Kafka streams) into the input layer.
- The preprocessing module standardizes data formats, scales numerical values, and handles missing data.
- The detection module processes data using algorithms like DBSCAN, Z-score, or neural networks.
- Outputs are sent to monitoring tools (e.g., Grafana, Prometheus) or trigger alerts via APIs for real-time action.
- A feedback loop updates the model based on new data or user input.
Integration Points with CI/CD or Cloud Tools
Anomaly detection integrates seamlessly with DataOps tools:
- CI/CD Pipelines: Validates data quality in automated workflows using tools like Jenkins, GitLab CI, or GitHub Actions.
- Cloud Tools: Leverages platforms like AWS SageMaker, Google Cloud AI, or Azure Machine Learning for scalable anomaly detection.
- Orchestration: Uses tools like Apache Airflow or Kubernetes to schedule and manage detection tasks in production.
Installation & Getting Started
Basic Setup or Prerequisites
To implement anomaly detection in a DataOps pipeline, you need:
- Python 3.8+ with libraries:
pandas,numpy,scikit-learn,pyod. - Optional: A cloud platform account (e.g., AWS, Google Cloud) for scalable deployments.
- A data source, such as a CSV file, database, or streaming service like Kafka.
- Basic knowledge of Python and data processing.
Hands-On: Step-by-Step Beginner-Friendly Setup Guide
This guide demonstrates anomaly detection using Python and the pyod library with an Isolation Forest algorithm.
- Install Dependencies:
pip install pandas numpy scikit-learn pyod- Prepare Sample Data:
Load a dataset (e.g., a CSV file with numerical features like sales or sensor data).
   import pandas as pd
data = pd.read_csv('sample_data.csv')- Preprocess Data:
Normalize numerical columns to ensure consistent scaling.
   from sklearn.preprocessing import StandardScaler
   scaler = StandardScaler()
scaled_data = scaler.fit_transform(data)- Apply Anomaly Detection:
Use the Isolation Forest algorithm frompyodto detect anomalies.
   from pyod.models.iforest import IForest
   model = IForest(contamination=0.1)  # Assume 10% of data are anomalies
   model.fit(scaled_data)
anomalies = model.predict(scaled_data) # Returns 1 for anomalies, 0 for normal- Visualize Results:
Add anomaly labels to the dataset and output results for analysis.
   data['anomaly'] = anomalies
   print(data[data['anomaly'] == 1])  # Display detected anomalies
This setup can be extended to integrate with cloud tools or real-time streams by replacing the CSV input with a database or Kafka connection.
Real-World Use Cases
Anomaly detection is widely applied in DataOps across industries. Here are four examples:
- Finance: Detects fraudulent transactions by identifying unusual patterns, such as large withdrawals from atypical locations. For example, a bank uses anomaly detection to flag transactions deviating from a customer’s spending profile.
- Healthcare: Monitors patient data in hospital systems, identifying anomalies like irregular heart rates or blood pressure readings to trigger timely interventions.
- E-Commerce: Ensures data quality in customer behavior logs, detecting anomalies like sudden spikes in page views that may indicate bot activity or data errors, improving recommendation systems.
- Manufacturing: Uses IoT sensor data to detect anomalies in equipment performance, such as temperature or vibration outliers, to predict and prevent machinery failures.
Benefits & Limitations
Key Advantages
- Improved Data Quality: Catches errors and inconsistencies early, ensuring reliable analytics.
- Proactive Issue Resolution: Enables real-time detection in automated pipelines, reducing downstream impact.
- Scalability: Adapts to diverse data types and volumes, from small datasets to big data environments.
Common Challenges or Limitations
- False Positives/Negatives: Improper thresholding or model tuning can lead to incorrect classifications.
- Computational Cost: Real-time detection on large datasets requires significant resources.
- Domain Expertise: Effective model tuning often requires understanding of the data’s context and behavior.
Best Practices & Recommendations
- Security: Encrypt sensitive data in transit and at rest to comply with regulations like GDPR or HIPAA.
- Performance: Use efficient algorithms like Isolation Forest for large datasets to minimize latency.
- Maintenance: Regularly retrain models to account for data drift and changing patterns.
- Compliance: Ensure anomaly detection processes align with industry standards for data handling and privacy.
- Automation: Integrate detection into CI/CD pipelines for continuous monitoring and alerting, using tools like Airflow or Jenkins.
Comparison with Alternatives
| Approach | Pros | Cons | Use Case |
|---|---|---|---|
| Statistical (Z-score) | Simple, fast, interpretable | Assumes data normality | Small, well-behaved datasets |
| ML (Isolation Forest) | Scalable, robust to noise | Requires parameter tuning | General-purpose anomaly detection |
| Deep Learning (Autoencoders) | Handles complex, high-dimensional data | High computational cost | Image or time-series data |
| Rule-Based | Highly interpretable, domain-specific | Limited flexibility, manual setup | Known anomaly patterns |
When to Choose Data Anomaly Detection
Opt for anomaly detection when:
- Data quality is critical to downstream analytics or machine learning models.
- Real-time monitoring is required in automated DataOps pipelines.
- Complex, high-dimensional data demands robust, scalable detection methods.
Conclusion
Data anomaly detection is a cornerstone of DataOps, enabling organizations to maintain data integrity, automate quality checks, and build trust in data-driven decisions. As DataOps evolves, advancements in AI-driven detection, real-time monitoring, and integration with cloud platforms will further enhance its impact. To get started, practitioners can explore open-source tools like pyod or leverage cloud-based solutions for scalability.