Introduction & Overview
Service Level Agreements (SLAs), Service Level Indicators (SLIs), and Service Level Objectives (SLOs) are foundational concepts in ensuring reliability, performance, and accountability in data operations (DataOps). This tutorial provides a deep dive into these concepts, their role in DataOps, and practical guidance for implementation.
- Purpose: Equip technical readers with the knowledge to implement SLAs, SLIs, and SLOs in DataOps workflows.
- Scope: Covers definitions, architecture, setup, use cases, benefits, limitations, and best practices.
- Audience: Data engineers, DevOps professionals, and IT managers working in DataOps environments.
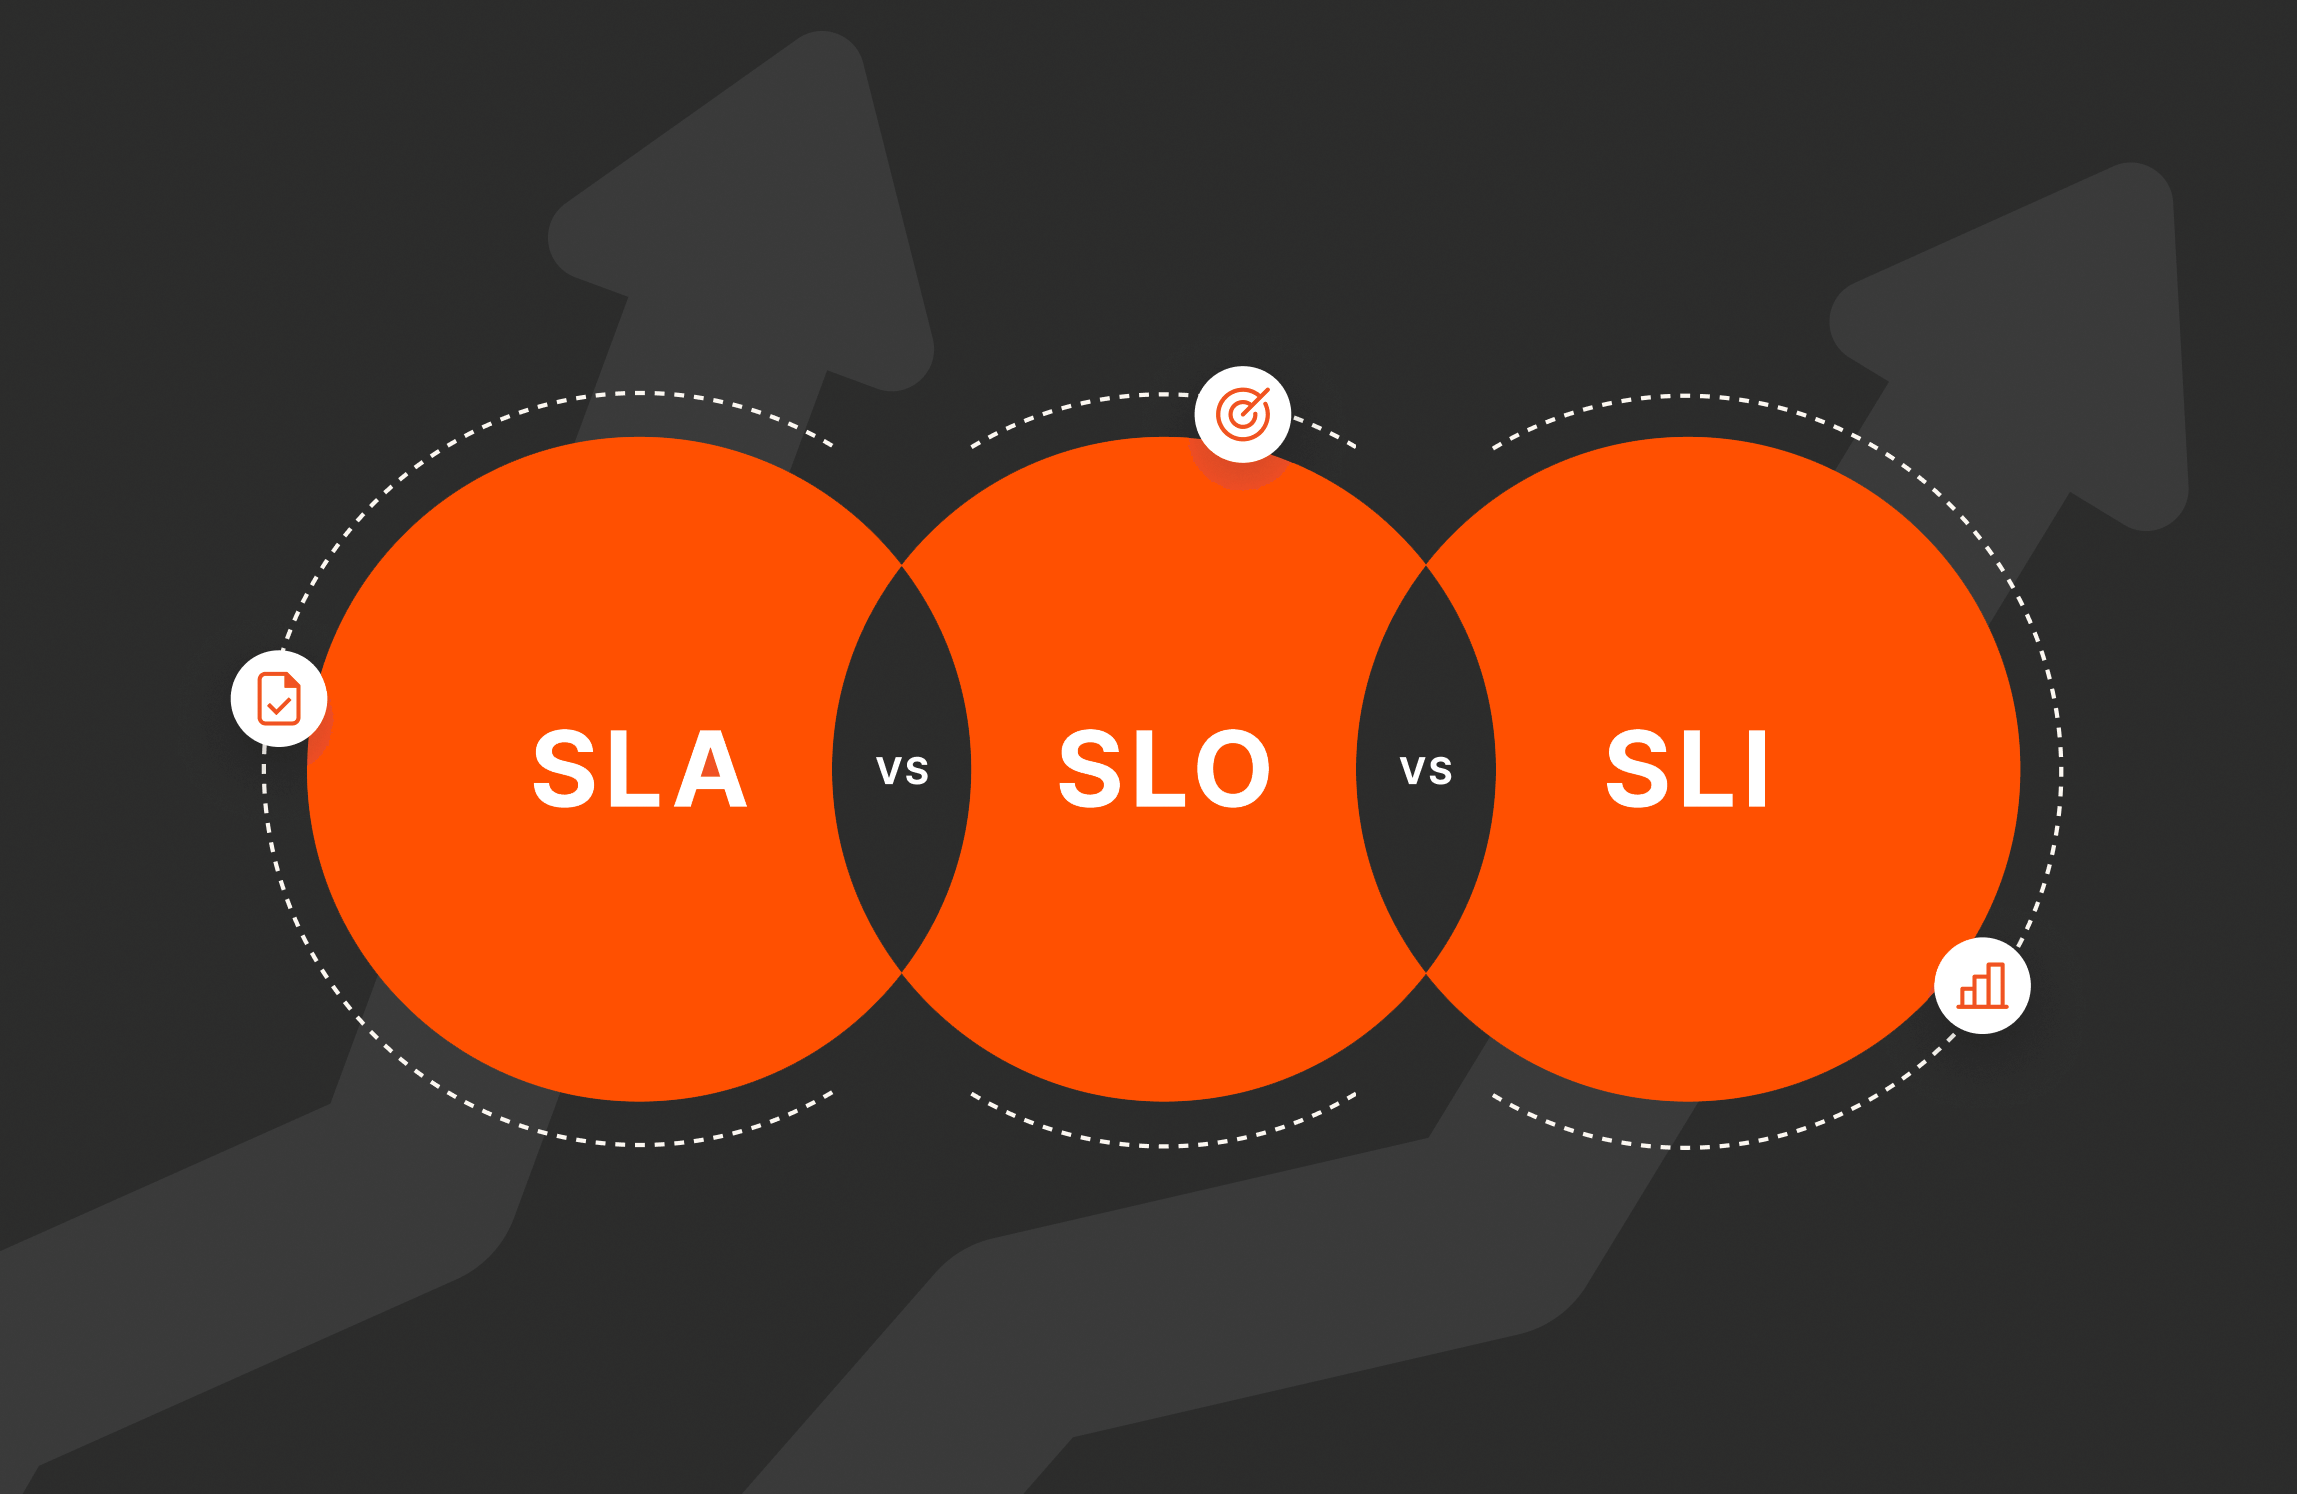
What are SLAs, SLIs, and SLOs?
Definitions
- SLA (Service Level Agreement): A contract between a service provider and a customer defining the expected level of service, including metrics like uptime, performance, and remedies for breaches.
- SLI (Service Level Indicator): A measurable metric that quantifies the performance or reliability of a service (e.g., pipeline success rate, data latency).
- SLO (Service Level Objective): A target value or range for an SLI, defining the desired performance level (e.g., 99% pipeline success rate).
History or Background
- Originated in IT service management (ITSM) and evolved with cloud computing and DevOps.
- SLAs became critical in DataOps as organizations prioritized data reliability and timeliness for analytics and machine learning.
- SLIs and SLOs, popularized by Site Reliability Engineering (SRE) practices at Google, provide a structured approach to measure and meet SLAs.
- 1990s: SLAs emerged in IT service management (ITIL/outsourcing contracts).
- 2000s: SRE (Site Reliability Engineering) by Google introduced SLIs/SLOs as practical measurement tools.
- Today: In DataOps, these practices extend to data pipelines, ML workflows, ETL jobs, cloud data lakes, and real-time analytics systems.
Why Relevant in DataOps?
- Data Reliability: Ensures data pipelines deliver accurate and timely data for business decisions.
- Accountability: Aligns data teams with business expectations, fostering trust.
- Automation and Scalability: Supports automated monitoring and scaling in modern cloud-based DataOps workflows.
Core Concepts & Terminology
Key Terms and Definitions
- Error Budget: The acceptable amount of downtime or errors within an SLO, balancing reliability and innovation.
- Latency: Time taken for data to move through a pipeline, a common SLI in DataOps.
- Throughput: Volume of data processed per unit time, another key SLI.
- Availability: Percentage of time a data service is operational, often tied to SLAs.
| Term | Definition | Example |
|---|---|---|
| SLA | Formalized commitment (contractual/business-level). | “99.9% availability of data pipeline per month.” |
| SLO | Internal objective that supports SLA. | “Pipeline jobs must complete within 10 min in 99% of cases.” |
| SLI | Measurement of performance. | “Actual average pipeline completion time = 9.5 min.” |
How It Fits into the DataOps Lifecycle
- Plan: Define SLOs based on business needs (e.g., data freshness for real-time analytics).
- Build: Design pipelines with SLIs to monitor performance (e.g., pipeline runtime, error rates).
- Operate: Continuously measure SLIs against SLOs and adjust processes to meet SLAs.
- Monitor: Use SLIs to detect issues early, ensuring compliance with SLAs.
Architecture & How It Works
Components and Internal Workflow
- Data Sources: Inputs like databases, APIs, or streaming platforms.
- Data Pipelines: ETL/ELT processes transforming and moving data.
- Monitoring Tools: Systems like Prometheus, Grafana, or cloud-native solutions (e.g., AWS CloudWatch) to track SLIs.
- Alerting Systems: Notify teams when SLIs deviate from SLOs, triggering remediation.
- Dashboards/Reports: Visualize SLIs for stakeholders to ensure SLA compliance.
Architecture Diagram Description
Imagine a diagram with:
- Left: Data sources (databases, Kafka streams).
- Center: Data pipeline (e.g., Apache Airflow, Spark) processing data.
- Right: Data warehouse (e.g., Snowflake, BigQuery) as the destination.
- Above: Monitoring tools (Prometheus, Grafana) collecting SLIs (latency, error rate).
- Below: Alerting system (PagerDuty, Slack) and dashboards for SLA reporting.
Integration Points with CI/CD or Cloud Tools
- CI/CD: SLIs/SLOs integrated into CI/CD pipelines (e.g., Jenkins, GitLab) to validate data pipeline deployments.
- Cloud Tools: AWS CloudWatch, Azure Monitor, or Google Cloud Operations Suite for real-time SLI tracking.
- Orchestration: Tools like Airflow or Kubernetes for scheduling and scaling pipelines, with SLO-driven configurations.
Installation & Getting Started
Basic Setup or Prerequisites
- A data pipeline tool (e.g., Apache Airflow, Prefect).
- A monitoring solution (e.g., Prometheus, Grafana).
- Access to a cloud provider (AWS, GCP, Azure) or on-premises infrastructure.
- Basic knowledge of metrics and alerting configurations.
Hands-on: Step-by-Step Beginner-Friendly Setup Guide
- Install Prometheus and Grafana:
# Install Prometheus
wget https://github.com/prometheus/prometheus/releases/download/v2.47.1/prometheus-2.47.1.linux-amd64.tar.gz
tar xvfz prometheus-2.47.1.linux-amd64.tar.gz
cd prometheus-2.47.1.linux-amd64
./prometheus --config.file=prometheus.yml &

# Install Grafana
wget https://dl.grafana.com/oss/release/grafana_10.1.0_amd64.deb
sudo dpkg -i grafana_10.1.0_amd64.deb
sudo systemctl start grafana-server
2. Configure Prometheus to Monitor a Data Pipeline:
# prometheus.yml
scrape_configs:
  - job_name: 'data_pipeline'
    static_configs:
      - targets: ['localhost:9090']
3. Define SLIs:
- Pipeline success rate:
sum(rate(pipeline_success_total[5m])) / sum(rate(pipeline_execution_total[5m])) - Latency:
histogram_quantile(0.95, sum(rate(pipeline_duration_seconds_bucket[5m])) by (le))
4. Set SLOs in Prometheus:
# prometheus.rules.yml
groups:
- name: data_pipeline
  rules:
  - alert: PipelineSuccessRateLow
    expr: sum(rate(pipeline_success_total[5m])) / sum(rate(pipeline_execution_total[5m])) < 0.99
    for: 5m
    labels:
      severity: critical
    annotations:
      summary: "Pipeline success rate below 99%"
5. Create Grafana Dashboard:
- Access Grafana at
http://localhost:3000, log in (default: admin/admin). - Add Prometheus as a data source and create a dashboard visualizing SLIs.
Real-World Use Cases
- Real-Time Analytics for E-Commerce:
- Scenario: Ensure product inventory data is updated every 5 minutes.
- SLO: Data latency < 5 minutes, 99.9% pipeline success rate.
- SLI: Measure pipeline runtime and error rate using Prometheus.
- SLA: Guarantee 99.9% data availability for business dashboards.
- Financial Reporting for Compliance:
- Scenario: Daily financial reports for regulatory submission.
- SLO: 100% report accuracy, delivery by 6 AM daily.
- SLI: Track data completeness and pipeline completion time.
- SLA: Contractual obligation to deliver reports on time.
- Healthcare Data Processing:
- Scenario: Process patient data for real-time monitoring.
- SLO: 99.95% data availability, < 1-second latency.
- SLI: Monitor ingestion rate and processing delays.
- SLA: Ensure data availability for critical care decisions.
- Ad Tech Campaign Optimization:
- Scenario: Real-time ad performance data for campaign adjustments.
- SLO: Data freshness < 10 seconds, 99% pipeline uptime.
- SLI: Measure event processing latency and pipeline failures.
- SLA: Guarantee data for real-time bidding systems.
Benefits & Limitations
Key Advantages
- Reliability: Ensures consistent data delivery for business-critical processes.
- Transparency: Clear metrics improve stakeholder trust.
- Proactive Management: Early detection of issues via SLIs prevents SLA breaches.
Common Challenges or Limitations
- Complexity: Setting meaningful SLOs requires deep business understanding.
- Overhead: Monitoring and alerting systems add operational costs.
- False Positives: Poorly defined SLIs can lead to unnecessary alerts.
Best Practices & Recommendations
- Security Tips:
- Encrypt data in transit and at rest to protect sensitive information.
- Use role-based access control (RBAC) for monitoring tools.
- Performance:
- Optimize pipeline efficiency to meet SLOs without over-provisioning resources.
- Use caching to reduce latency in high-throughput pipelines.
- Maintenance:
- Regularly review SLOs to align with evolving business needs.
- Automate SLI collection and alerting to reduce manual overhead.
- Compliance Alignment:
- Ensure SLAs meet regulatory requirements (e.g., GDPR, HIPAA).
- Log SLIs for audit trails in regulated industries.
- Automation Ideas:
- Use Infrastructure-as-Code (IaC) for monitoring setup (e.g., Terraform).
- Implement auto-scaling based on SLI thresholds.
Comparison with Alternatives
| Aspect | SLAs/SLIs/SLOs | Traditional Monitoring |
|---|---|---|
| Focus | Service reliability and business goals | System-level metrics (CPU, memory) |
| Granularity | Specific to data pipeline performance | Broad system health |
| Business Alignment | Directly tied to SLAs and user needs | Often technical, less business-focused |
| Proactivity | Proactive via error budgets | Reactive to system failures |
When to Choose SLAs/SLIs/SLOs
- Use when data reliability directly impacts business outcomes (e.g., real-time analytics, compliance).
- Prefer traditional monitoring for infrastructure-focused environments without strict data SLAs.
Conclusion
SLAs, SLIs, and SLOs are critical for aligning DataOps with business objectives, ensuring reliable and timely data delivery. By defining clear metrics and objectives, teams can proactively manage pipelines and meet contractual obligations.
- Future Trends: Increased adoption of AI-driven SLO optimization and real-time SLI monitoring in serverless architectures.
- Next Steps: Experiment with Prometheus/Grafana setups and refine SLOs based on business feedback.
- Resources:
- Prometheus Documentation
- Grafana Documentation
- Google SRE Book
Category: