Introduction & Overview
What is Root Cause Analysis?
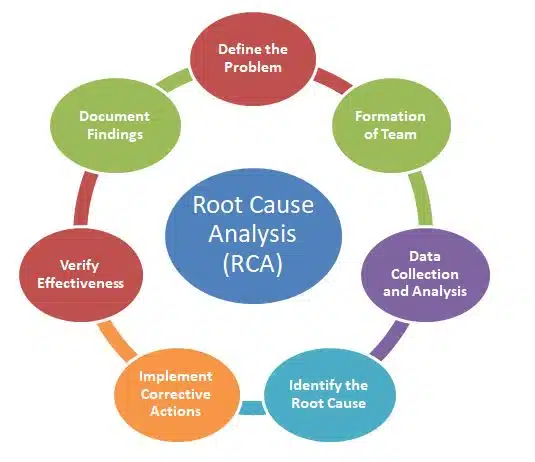
Root Cause Analysis (RCA) is a systematic process used to identify the underlying causes of problems or incidents in a system. In DataOps, RCA focuses on diagnosing issues in data pipelines, analytics workflows, or data quality to prevent recurrence and improve system reliability. It goes beyond surface-level symptoms to pinpoint the fundamental issue, ensuring long-term solutions.
History or Background
RCA originated in engineering and manufacturing, notably popularized by Toyota’s “5 Whys” methodology in the 1950s as part of lean manufacturing. It has since been adopted in IT, DevOps, and DataOps to troubleshoot complex systems. In DataOps, RCA has evolved to address challenges like data pipeline failures, data quality issues, and performance bottlenecks, aligning with the need for reliable data delivery.
- 1960s: RCA was formalized in industrial engineering and safety-critical industries (aviation, nuclear plants).
- 1990s–2000s: Adopted in IT operations and DevOps for debugging large systems.
- 2020s: With DataOps, RCA became crucial due to complex data pipelines, distributed cloud environments, and continuous integration of datasets.
Why is it Relevant in DataOps?
DataOps integrates development, operations, and data management to deliver high-quality, reliable data products. RCA is critical in this context because:
- It identifies the source of data pipeline failures or inaccuracies.
- It ensures data quality by resolving issues at their root.
- It supports continuous improvement in automated data workflows.
- It aligns with DataOps principles of collaboration, automation, and monitoring.
Core Concepts & Terminology
Key Terms and Definitions
- Root Cause: The primary reason for a problem, which, if resolved, prevents recurrence.
- Incident: An event causing disruption, such as a pipeline failure or data inconsistency.
- 5 Whys: A technique that iteratively asks “why” to drill down to the root cause.
- Fishbone Diagram: A visual tool (Ishikawa diagram) to categorize potential causes of an issue.
- Fault Tree Analysis: A method to map logical relationships between events and causes.
| Term | Definition |
|---|---|
| Root Cause | The fundamental reason why a problem occurs. |
| Symptom | The visible effect of a deeper issue (e.g., data delay). |
| Incident | An event indicating service disruption or data failure. |
| 5 Whys | A questioning method to drill down to the real cause. |
| Fishbone Diagram (Ishikawa) | A visual tool to categorize causes of issues. |
| Data Lineage | Tracing how data flows through pipelines to pinpoint failure. |
| Incident Correlation | Mapping related failures across different systems. |
How It Fits into the DataOps Lifecycle
DataOps involves stages like data ingestion, processing, analysis, and delivery. RCA integrates as follows:
- Monitoring: Detects anomalies in pipelines or data quality (e.g., missing data).
- Diagnosis: RCA identifies why an issue occurred (e.g., schema mismatch).
- Resolution: Fixes the issue and updates processes to prevent recurrence.
- Feedback Loop: Incorporates learnings into automation and CI/CD pipelines to improve future iterations.
Architecture & How It Works
Components and Internal Workflow
RCA in DataOps involves several components:
- Data Collection: Gathering logs, metrics, and metadata from data pipelines.
- Analysis Tools: Software like Grafana, ELK Stack, or custom Python scripts to analyze logs.
- Collaboration Platforms: Tools like Slack or Jira for team coordination during RCA.
- Resolution Process: Steps to validate and fix the root cause.
Workflow:
- Identify the incident (e.g., pipeline failure).
- Collect relevant data (logs, metrics).
- Analyze using RCA techniques (e.g., 5 Whys, Fishbone).
- Validate the root cause.
- Implement and test fixes.
- Document and update processes to prevent recurrence.
Architecture Diagram
The architecture for RCA in DataOps includes:
- Data Pipeline: Tools like Apache Airflow or Kafka manage data flow.
- Monitoring Layer: Prometheus and Grafana provide real-time metrics and alerts.
- Logging Layer: ELK Stack (Elasticsearch, Logstash, Kibana) centralizes logs.
- RCA Tools: Python scripts or BI tools analyze logs and metrics.
- CI/CD Integration: Jenkins or GitHub Actions automate deployment of fixes.
[Data Sources] → [Ingestion Tools] → [Processing Engine] → [Storage/Warehouse] → [Analytics/BI]

      ↑ Monitoring (Logs, Metrics, Traces)
      ↓
 [RCA Engine] → [Correlation + Analysis] → [Root Cause Report]
Diagram Description: Imagine a flowchart where data flows through an Airflow pipeline. Metrics are sent to Prometheus, visualized in Grafana. Logs are ingested into Elasticsearch via Logstash and queried in Kibana. RCA tools process outputs, and fixes are deployed via a CI/CD pipeline (e.g., Jenkins). Arrows show data flow between components, with collaboration tools (Slack, Jira) linked for team communication.
Integration Points with CI/CD or Cloud Tools
RCA integrates with:
- CI/CD: Automates testing and deployment of fixes (e.g., Jenkins pipelines for updated pipeline code).
- Cloud Tools: AWS CloudWatch, Azure Monitor for real-time diagnostics and metrics.
- Collaboration: Jira for tracking RCA tasks, Slack for real-time alerts.
Installation & Getting Started
Basic Setup or Prerequisites
To implement RCA in a DataOps environment, you need:
- Environment: Python 3.8+, Docker for containerized tools.
- Tools: ELK Stack, Prometheus, Grafana, Apache Airflow.
- Access: Cloud platform (AWS, Azure, GCP) for logs and metrics.
- Skills: Basic Python, SQL, and familiarity with DataOps tools.
Hands-on: Step-by-Step Beginner-Friendly Setup Guide
This guide sets up a basic RCA environment using Python and ELK Stack.
- Install ELK Stack (Elasticsearch, Logstash, Kibana):
   docker pull docker.elastic.co/elasticsearch/elasticsearch:8.8.0
   docker pull docker.elastic.co/logstash/logstash:8.8.0
   docker pull docker.elastic.co/kibana/kibana:8.8.0
Run containers with appropriate configurations (refer to Elastic’s official docs for setup details).
- Set Up a Sample Data Pipeline:
Use Apache Airflow to create a simple pipeline:
   from airflow import DAG
   from airflow.operators.python import PythonOperator
   from datetime import datetime

   def process_data():
       # Sample data processing logic
       print("Processing data...")

   with DAG('sample_pipeline', start_date=datetime(2025, 1, 1), schedule_interval='@daily') as dag:
task = PythonOperator(task_id='process_data', python_callable=process_data)- Simulate an Incident:
Modify the pipeline to fail (e.g., introduce a null value error in the data processing logic). - Collect Logs:
Configure Logstash to ingest Airflow logs into Elasticsearch. - Analyze with Kibana:
Use Kibana to query logs and identify the error (e.g., “null value in column X”). - Apply 5 Whys:
- Why did the pipeline fail? Null value in column X.
- Why was there a null value? Upstream data source was incomplete.
- Why was it incomplete? API failed to fetch data.
- Why did the API fail? Rate limit exceeded.
- Why was the limit exceeded? Misconfigured retry logic.
Root Cause: Misconfigured retry logic.
7. Fix and Deploy:
Update the pipeline with proper retry logic (e.g., add exponential backoff) and redeploy via CI/CD.
Real-World Use Cases
- Pipeline Failure in Financial Data Processing:
A bank’s ETL pipeline fails due to schema changes in a third-party API. RCA identifies an untracked schema update. Fix: Implement schema validation checks in the pipeline. - Data Quality Issue in E-Commerce:
An e-commerce platform shows incorrect product recommendations due to corrupt data. RCA traces it to a faulty data transformation script. Fix: Add data quality checks before transformation. - Performance Bottleneck in Healthcare Analytics:
A hospital’s dashboard queries are slow. RCA reveals inefficient SQL joins in the data warehouse. Fix: Optimize queries and add caching with Redis. - Regulatory Compliance in Insurance:
Missing data in compliance reports violates regulations. RCA finds a misconfigured data retention policy. Fix: Update retention settings and automate compliance checks.
Benefits & Limitations
Key Advantages
- Improves data reliability by addressing root causes.
- Reduces downtime in data pipelines.
- Enhances collaboration across data, ops, and dev teams.
- Supports proactive monitoring and automation in DataOps.
Common Challenges or Limitations
- Time-intensive for complex systems with multiple failure points.
- Requires comprehensive logging and monitoring setup.
- May miss root causes if data or logs are incomplete.
- Needs skilled analysts to perform effective RCA.
Best Practices & Recommendations
- Security: Encrypt logs and restrict access to RCA tools to authorized users.
- Performance: Use indexed logs in Elasticsearch for faster querying.
- Maintenance: Regularly update monitoring rules and RCA templates.
- Compliance: Align RCA processes with GDPR, HIPAA, or industry-specific standards.
- Automation: Integrate RCA with CI/CD pipelines for automated testing and deployment of fixes.
Comparison with Alternatives
| Approach | Strengths | Weaknesses |
|---|---|---|
| RCA | Systematic, prevents recurrence | Time-intensive, needs expertise |
| Log Analysis | Quick, good for surface issues | Misses deeper causes |
| Automated Alerts | Fast detection, scalable | Limited to predefined rules |
| Ad-Hoc Debugging | Flexible, immediate | Inconsistent, error-prone |
When to Choose RCA
Use RCA when:
- Issues recur or have high impact on data quality or pipeline reliability.
- Complex systems require deep analysis to uncover hidden causes.
- Compliance or data quality is critical (e.g., in finance or healthcare).
Conclusion
Root Cause Analysis is a cornerstone of DataOps, enabling teams to maintain reliable, high-quality data pipelines. By systematically addressing issues, RCA supports automation, collaboration, and continuous improvement. Future trends include AI-driven RCA for faster diagnostics and deeper integration with cloud-native tools like Kubernetes or serverless platforms. To get started, explore tools like ELK Stack or Apache Airflow and engage with DataOps communities for best practices.
Future Trends
- AI/ML-powered predictive RCA
- Integration with LLMs for RCA report automation
- RCA as a service in cloud-native observability platforms
Next Steps
- Start with open-source tools (Prometheus, Grafana, ELK, OpenTelemetry).
- Gradually adopt automated RCA platforms.
- Train teams on 5 Whys, Fishbone, and data lineage tracing.
Resources:
- Google SRE Book – Postmortems & RCA
- OpenTelemetry Documentation
- Apache Airflow Docs