1. Introduction & Overview
🔍 What is Tableau?
Tableau is a powerful data visualization and business intelligence (BI) tool that enables users to transform raw data into interactive, shareable dashboards. It helps teams understand patterns, trends, and insights through visual analytics.
🕰️ History or Background
- Founded in 2003 by Chris Stolte, Christian Chabot, and Pat Hanrahan at Stanford.
- Acquired by Salesforce in 2019.
- Originally designed to simplify the process of working with data for non-technical users.
- Widely adopted across industries for decision-making, forecasting, and performance monitoring.
🛡️ Why is it Relevant in DevSecOps?
In DevSecOps, Tableau plays a crucial role in:
- Visualizing security vulnerabilities across development pipelines.
- Monitoring compliance metrics and audit logs.
- Reporting CI/CD health, deployment frequencies, change failure rates.
- Enabling real-time dashboards for risk & threat analysis.
By bridging the gap between raw security data and actionable insights, Tableau enhances decision-making and proactive responses in DevSecOps workflows.
2. Core Concepts & Terminology
📘 Key Terms & Definitions
| Term | Definition |
|---|---|
| Dashboard | A visual interface displaying key metrics, KPIs, or logs. |
| Workbook | Collection of worksheets and dashboards. |
| Data Source | The backend connection to your data (CSV, SQL, cloud, etc.) |
| Extract | A snapshot of your data saved locally or on Tableau Server. |
| Live Connection | Real-time data connection without saving data in Tableau. |
| VizQL | Visualization Query Language used internally by Tableau. |
| Calculated Field | Custom logic for generating new values in visualizations. |
🔄 How it Fits into the DevSecOps Lifecycle
| DevSecOps Stage | Tableau Role |
|---|---|
| Plan | Analyze historical security & incident trends. |
| Develop | Visualize code scan results (SAST, DAST, etc.). |
| Build/Test | Track CI/CD pipeline health and security testing results. |
| Release/Deploy | Monitor production deployment risks and metrics. |
| Operate | Observe runtime logs, performance KPIs. |
| Monitor | Real-time dashboards of security events, threats, anomalies. |
3. Architecture & How It Works
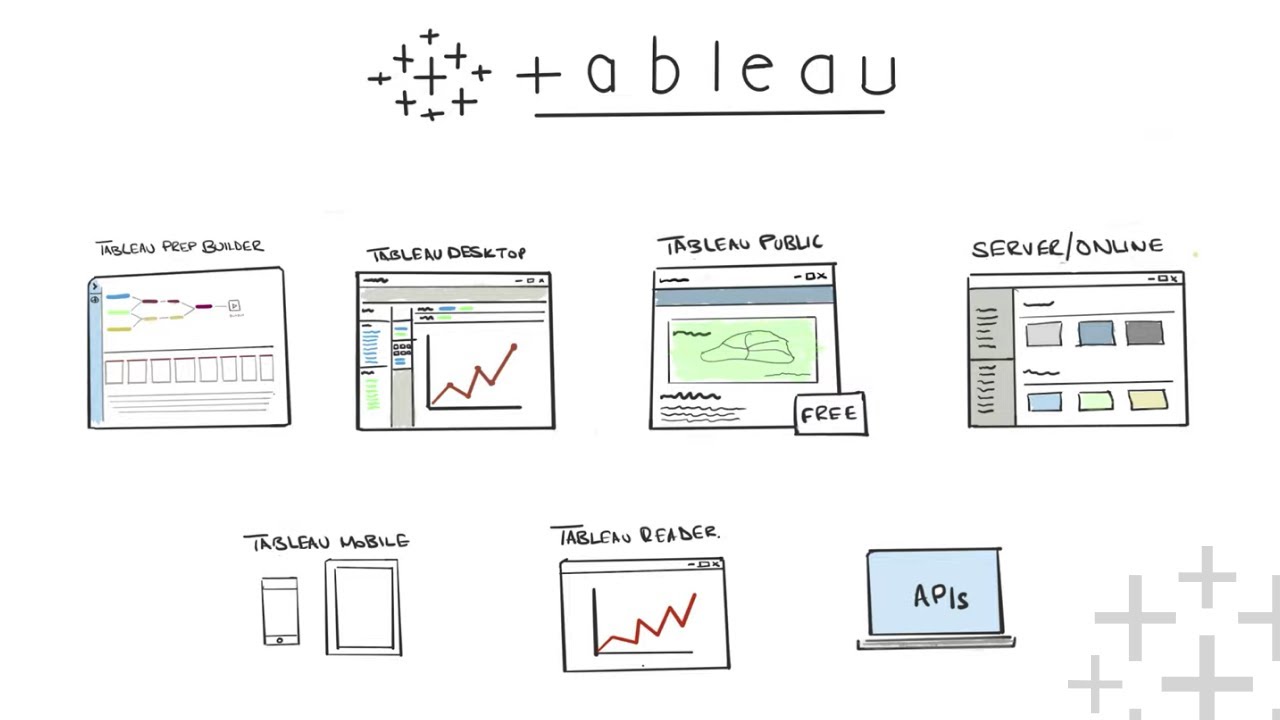
🧩 Components
- Tableau Desktop: For authoring reports and dashboards.
- Tableau Server / Online: For sharing and managing content.
- Tableau Public: Free platform for sharing publicly.
- Tableau Prep: Data cleansing and preparation tool.
- Tableau Bridge: Keeps on-prem data synced with Tableau Online.

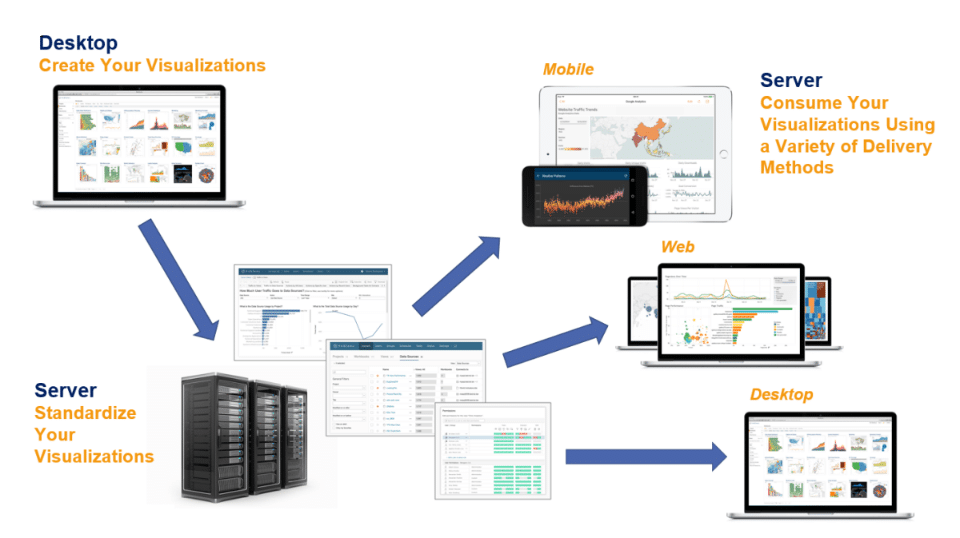
🔁 Internal Workflow
- Connect to a data source (cloud, CSV, API, SQL, etc.)
- Perform data prep (cleaning, joining, filtering)
- Build visualizations (charts, tables, maps)
- Create dashboards & publish to Tableau Server/Online
- Schedule updates and alerts based on data conditions
🏗️ Architecture Diagram (Descriptive)
[DevSecOps Tools] ---> [Data Lake / Logs / SIEM / CI/CD Metrics]
                        |
                  [Tableau Data Connector]
                        |
               [Data Engine & VizQL Server]
                        |
              [Tableau Server / Tableau Online]
                        |
          [Web UI / Embedded Dashboards / APIs]
🔌 Integration Points with DevSecOps Tools
| Tool | Integration Method |
|---|---|
| Jenkins / GitHub Actions | Export build/test logs → CSV/API → Tableau |
| SonarQube / Snyk / OWASP ZAP | Use REST API or DB exports for Tableau ingestion |
| AWS CloudTrail, Azure Logs | Direct connectors or export to S3/Blob & ingest |
| Prometheus, Grafana | Export JSON/CSV snapshots or use intermediary DB |
| Splunk, ELK | Connect via ODBC, JDBC, or scheduled extracts |
4. Installation & Getting Started
⚙️ Prerequisites
- Tableau Desktop license (14-day trial available)
- Basic familiarity with data sources (CSV, SQL)
- Optional: Tableau Server for sharing dashboards
- Python/REST API skills if integrating advanced pipelines
👣 Step-by-Step Setup Guide (Beginner)
- Download & Install Tableau Desktop
- Launch & Connect to Data
- Open Tableau Desktop → “Connect” to CSV, Excel, or Database.
- Example: Load OWASP ZAP scan results in CSV.
- Data Cleaning (optional)
- Remove nulls, rename columns, define types.
- Build Visuals
- Drag
Severityto Columns andCountto Rows. - Add filters like
Project = XYZ.
- Drag
- Create Dashboard
- Combine charts into a layout.
- Add interactivity: filters, drop-downs.
- Publish to Tableau Public or Server
- File → Save to Tableau Public / Publish to Server.
- Schedule Refreshes & Alerts
- Use Tableau Server or scripts to refresh dashboards based on CI/CD triggers.
5. Real-World Use Cases
🔐 1. Security Vulnerability Dashboard
- Integrate SonarQube scan data.
- Visualize high/critical issues across repos.
- Alert when thresholds are breached.
🧪 2. CI/CD Pipeline Health Monitor
- Track job success/failure rates from Jenkins.
- Visualize trends over weeks/months.
📋 3. Audit Compliance Reporting
- Pull logs from AWS CloudTrail and Azure Monitor.
- Show access violations, unauthorized actions.
🛡️ 4. Threat Detection
- Connect to a SIEM (like Splunk or ELK).
- Display real-time threat levels, IP addresses, geolocation maps.
6. Benefits & Limitations
✅ Key Advantages
- Intuitive drag-and-drop interface.
- Real-time visibility into security & ops data.
- Cross-platform, supports various data sources.
- Advanced analytics using calculated fields and filters.
⚠️ Common Challenges
- Steep cost for enterprise features.
- Requires data prep and schema understanding.
- Limited custom visual control vs code-first tools (e.g., D3.js).
- Can be slow with very large datasets (unless optimized extracts used).
7. Best Practices & Recommendations
🔐 Security & Compliance Tips
- Use row-level security for role-based data access.
- Integrate with SSO/LDAP on Tableau Server.
- Audit Tableau access logs for compliance needs.
- Mask sensitive data using calculated fields.
⚙️ Performance & Automation
- Use Hyper extracts instead of live connections for speed.
- Automate data refresh with Tableau’s REST API.
- Enable email alerts for KPI threshold breaches.
🤖 DevSecOps Automation Ideas
- Trigger dashboard refresh post-Jenkins deployment.
- Auto-email reports after a failed SAST/DAST scan.
- Embed Tableau dashboards in developer portals (e.g., Backstage).
8. Comparison with Alternatives
| Tool | Tableau | Power BI | Grafana | Kibana |
|---|---|---|---|---|
| Ease of Use | ⭐⭐⭐⭐ | ⭐⭐⭐⭐ | ⭐⭐ | ⭐⭐ |
| DevSecOps Integration | ⭐⭐⭐⭐ | ⭐⭐⭐ | ⭐⭐⭐⭐ | ⭐⭐⭐⭐ |
| Cost | High | Medium | Free/Open Source | Free/Open Source |
| Custom Visuals | Moderate | Good | Excellent | Good |
| Security Focus | Medium | Medium | High | High |
When to Choose Tableau
- When your team values drag-and-drop BI tools.
- Need for polished, shareable dashboards for executives or auditors.
- Requires integration with multiple data sources.
- You want automated compliance reporting with visual workflows.
9. Conclusion
Tableau, though traditionally seen as a BI tool, has become a powerful ally in DevSecOps. Its ability to transform security and operational data into actionable visual dashboards helps teams:
- Identify risks faster,
- Monitor pipelines efficiently, and
- Align with compliance needs.
🔗 Useful Resources
- Official Docs: https://help.tableau.com
- Tableau Community: https://community.tableau.com
- DevSecOps Use Cases: https://tableau.com/solutions/devops
Category: