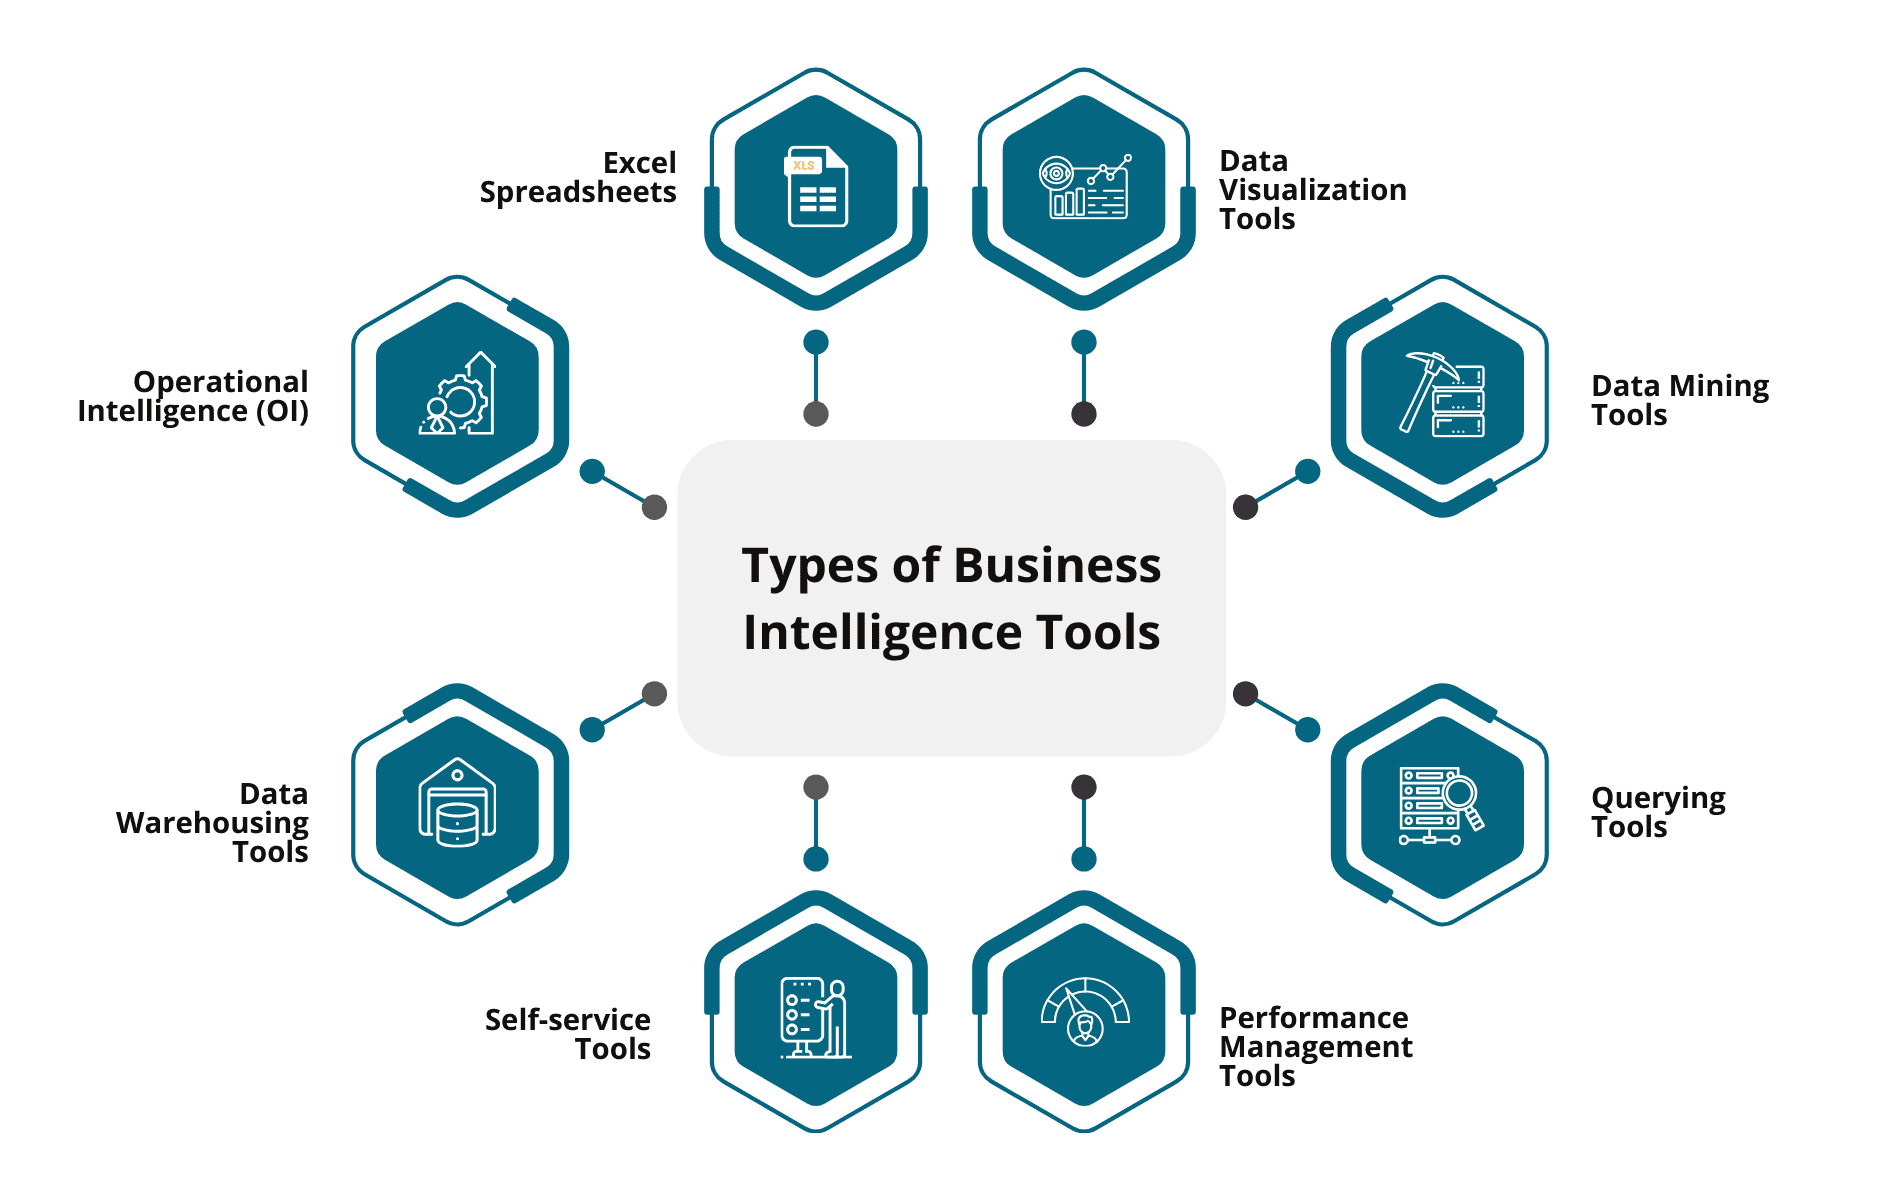
Business Intelligence (BI) tools are software platforms used to gather, process, analyze, and visualize data to support informed decision-making. These tools enable teams to track KPIs, generate reports, monitor anomalies, and uncover patterns from large data volumes.
History & Background
Early BI systems originated in the 1960s as decision support systems (DSS).
The 1990s saw the rise of modern BI platforms like Cognos and BusinessObjects.
Cloud-native and open-source BI tools such as Tableau, Power BI, Metabase, and Superset emerged in the 2010s.
Today, BI tools are evolving to include AI/ML, real-time dashboards, and DevOps integrations.
Why Are BI Tools Relevant in DevSecOps?
In DevSecOps, data from code repositories, CI/CD pipelines, security scanners, and runtime monitoring needs to be aggregated and analyzed. BI tools help DevSecOps teams by:
Visualizing compliance and security metrics
Tracking vulnerabilities across pipelines
Auditing user activity
Driving continuous improvement with KPIs
2. Core Concepts & Terminology
Key Terms
Term
Definition
Dashboard
Visual interface showing key metrics and trends
ETL/ELT
Extract, Transform, Load processes for data ingestion
Data Warehouse
Centralized repository for structured data
Embedded Analytics
Integration of BI visualizations into other apps
Data Connector
Interface to import/export data from external systems
Drill-down
Ability to explore deeper levels of data from a summary
How It Fits into the DevSecOps Lifecycle
Phase
BI Tool Usage
Plan
Track requirements, policy violations, backlog health
Develop
Monitor coding practices, static analysis results
Build
Visualize test pass/fail trends
Test
Consolidate DAST/SAST/IAST scan outputs
Release
Alert on release readiness or failures
Deploy
Monitor deployments across environments
Operate
Real-time monitoring of logs, metrics, and anomalies
Monitor
Security incident trends, compliance status dashboards
Warehousing (Snowflake, Redshift) or direct query engines (Presto)
Visualization Layer:
BI dashboards, charts, graphs
Access Control Layer:
Role-based access, row-level security
Internal Workflow
graph TD
A[DevSecOps Tools] --> B[ETL/Connectors]
B --> C[BI Tool Engine]
C --> D[Dashboards & Reports]
C --> E[Alerts/Notifications]
Integration Points
CI/CD Tool
Integration Method
Jenkins
Plugin to push data to database
GitLab CI
API-based logging to a central data store
AWS CloudWatch
Export logs to BI-compatible formats
Kubernetes
Prometheus → Grafana, or metrics pushed to data lake
Security Tools
Parse outputs from Snyk, ZAP, Trivy into data pipelines
4. Installation & Getting Started
Basic Setup
System Requirements:
Docker or Python environment (for open-source BI tools)
Access to databases (PostgreSQL, MySQL, etc.)
Recommended Tools:
Superset (open-source)
Metabase (easy setup)
Power BI (enterprise)
Looker, Tableau (advanced)
Hands-on: Setup with Apache Superset
# Step 1: Clone the Superset repo
git clone https://github.com/apache/superset.git
cd superset

# Step 2: Use Docker Compose to set up services
docker-compose -f docker-compose-non-dev.yml up

# Step 3: Initialize the database
docker exec -it superset_app bash
superset db upgrade
superset fab create-admin
superset init

# Step 4: Open localhost:8088 and log in
Connect Data Source: Connect PostgreSQL/MySQL used by Jenkins or GitLab
Create Dashboard: Drag-drop charts (bar, pie, line) and schedule updates
Set Alerts: Add thresholds (e.g., open vulnerabilities > 10)
5. Real-World Use Cases
1. Vulnerability Tracking
Aggregate Trivy or ZAP scan results
Visualize per-project CVE trends
Automate alerts when CVEs exceed severity thresholds
2. Compliance Dashboards
Monitor whether deployed artifacts meet CIS or SOC2 controls
Show percentage of scanned images vs unscanned
Generate automated PDF compliance reports
3. Deployment Failure Analysis
Correlate failed builds, test coverage, and release rollbacks
Show error rate over time
Alert teams when threshold crossed
4. GitOps Change Metrics
Track pull request approvals, commit velocity
Visualize MTTR (Mean Time to Recovery) and change failure rate (DORA metrics)
Industry-Specific Examples
Industry
BI Tool Use Case
Finance
Real-time audit logs and SOX compliance tracking
Healthcare
HIPAA-centric data access logs and breach visualizations
Retail
App performance metrics with regional incident maps
6. Benefits & Limitations
Key Benefits
Centralized visibility across security, ops, and dev
Data-driven decisions backed by real-time insights
Flexible and extensible via APIs and connectors
Alerting and anomaly detection built-in
Limitations
May require data engineering effort for complex pipelines
Security concerns if misconfigured (exposed dashboards)
Vendor lock-in (for proprietary platforms)
Learning curve for non-technical users
7. Best Practices & Recommendations
Security
Enforce RBAC for dashboard and data access
Enable audit logging for BI activity
Encrypt data at rest and in transit
Performance
Use materialized views for large datasets
Enable caching for slow queries
Schedule ETL during off-peak hours
Compliance
Align dashboards with NIST, CIS, or OWASP benchmarks
Automate compliance reports (PDF/CSV)
Retain historical data for audit readiness
Automation Ideas
Use webhooks to trigger BI updates post-pipeline
Integrate Slack/Teams for dashboard alerts
Schedule nightly anomaly detection scans
8. Comparison with Alternatives
Tool
Strength
Limitation
Power BI
Deep integration with Microsoft stack
Windows-centric
Tableau
Rich visualization, enterprise-grade
Expensive
Metabase
Easy to use, open source
Limited advanced features
Superset
Powerful, customizable
Requires Docker knowledge
Grafana (with Loki/Tempo)
Great for logs/metrics
Less BI-oriented
When to Choose BI Tools in DevSecOps
You want central dashboards for all security/dev/ops data
Your teams use multiple data sources (e.g., Git, Jenkins, scanners)
Need non-technical stakeholders to understand security posture
Require custom compliance visualization pipelines
9. Conclusion
BI tools offer a critical advantage in DevSecOps by unlocking actionable insights from complex, scattered, and fast-moving data sources. With effective integration and governance, they empower teams to track risks, measure performance, and maintain continuous security compliance.
Software teams in Japan are under real pressure. Business leaders want new features every week. Customers expect apps to work all the time. But many internal teams…
Introduction Picture an analyst opening a dashboard first thing in the morning. The sales chart is empty. A pipeline broke overnight, and nobody knows why. The analyst…
Here’s something most software ads never admit: half the tools bought each year sit unused within three months. Sounds surprising? It shouldn’t. Bright banners promise magic fixes….
Hyderabad is a busy city. Something new happens every week. New cafes open. Bands play live shows. Comedians make people laugh. But there is one big problem….
Introduction Your sales team asks for a minor dashboard tweak on Monday morning. You update the query, hit refresh, and wait. By Tuesday afternoon, the live revenue…