1. Introduction & Overview
What is Data Observability?
Data Observability is the capability to fully understand the health, reliability, and lineage of data across an organization’s data systems. It enables teams to monitor, detect, root-cause, and resolve data issues proactively.
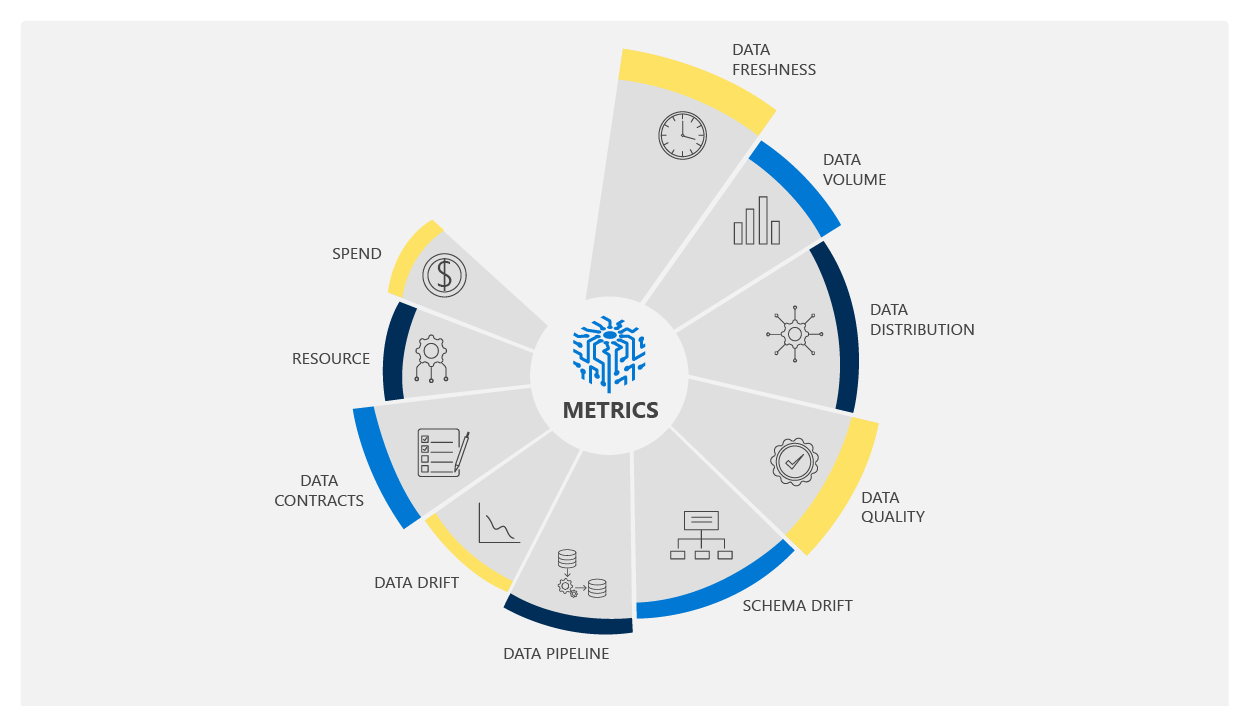
It is an emerging discipline in modern data engineering and DevSecOps that extends traditional observability (metrics, logs, traces) to include data pipelines, data quality, metadata, and usage behavior.
History or Background
- Born out of the need to treat data like code, with monitoring and alerting principles borrowed from software observability.
- Evolved from DataOps and Site Reliability Engineering (SRE).
- Gained traction with the explosion of cloud-native data platforms, data mesh, and regulatory compliance requirements.
Why is it Relevant in DevSecOps?
- Ensures secure, accurate, and timely data throughout CI/CD workflows.
- Detects data breaches, leaks, schema drifts, and pipeline failures early.
- Integrates with DevSecOps for automated compliance, auditing, and governance.
- Reduces Mean Time to Detect (MTTD) and Mean Time to Resolve (MTTR) for data issues.
2. Core Concepts & Terminology
Key Terms and Definitions
| Term | Definition |
|---|---|
| Data Quality | Validity, completeness, accuracy, and consistency of data. |
| Data Lineage | The path data follows from source to consumption. |
| Data Pipeline | Series of processing steps transforming raw data to insights. |
| Metadata | Data that describes data (e.g., schema, source, format). |
| SLAs/SLOs | Agreements and objectives for data freshness, accuracy, and availability. |
| Anomaly Detection | Automated detection of unexpected data patterns. |
How It Fits into the DevSecOps Lifecycle
| DevSecOps Phase | Data Observability Role |
|---|---|
| Plan | Define data SLAs/SLOs, security requirements. |
| Develop | Validate schema changes, enforce data contracts. |
| Build | Integrate data validation in CI pipelines. |
| Test | Use test data profilers, detect leaks or drift. |
| Release | Monitor post-release data impact. |
| Deploy | Trace production data lineage. |
| Operate | Alert on anomalies, ensure data uptime. |
| Monitor | Continuously evaluate data quality and access patterns. |
3. Architecture & How It Works
Components
- Data Monitors: Track freshness, completeness, volume, schema, and distributions.
- Lineage Trackers: Visualize upstream/downstream relationships.
- Anomaly Detection Engine: ML/Rule-based detection of data drift and outliers.
- Metadata Collector: Centralized collection of schema, usage, and permissions.
- Alerting & Incident Management: Notify stakeholders on violations.

Internal Workflow
- Connect to data sources (databases, data lakes, warehouses).
- Extract metadata and statistical summaries.
- Continuously monitor data pipelines.
- Detect issues using anomaly detectors.
- Send alerts to incident response systems.
- Visualize lineage and impact across dashboards.
Architecture Diagram (Descriptive)
[Data Sources] --> [Data Collector] --> [Metadata + Stats Store]
                        |
                 [Anomaly Detection Engine]
                        |
           [Alerting System] --> [DevSecOps Tools (e.g., Jira, PagerDuty)]
                        |
             [Lineage & Dashboards for Users]
Integration Points with CI/CD and Cloud
- CI/CD: Validate schema compatibility during PR checks.
- Kubernetes: Sidecar containers to monitor ETL/ELT jobs.
- Terraform: Enforce observability as code for data SLAs.
- Cloud Services: AWS Glue, GCP BigQuery, Snowflake, Azure Synapse.
4. Installation & Getting Started
Basic Setup or Prerequisites
- Python 3.8+
- Access to data sources (e.g., PostgreSQL, Snowflake)
- Docker or Kubernetes (for scalable deployments)
- Access credentials or tokens for cloud data platforms
Hands-on: Quickstart with Open-Source Tool OpenMetadata
Step-by-Step Setup:
# Step 1: Clone the repo
git clone https://github.com/open-metadata/OpenMetadata.git
cd OpenMetadata

# Step 2: Start services using Docker Compose
docker-compose up -d

# Step 3: Open UI at http://localhost:8585

# Step 4: Ingest metadata from PostgreSQL
# Example config
{
  "source": {
    "type": "postgres",
    "serviceName": "my_postgres_db",
    "config": {
      "username": "admin",
      "password": "admin123",
      "hostPort": "localhost:5432",
      "database": "sales_db"
    }
  }
}
- Monitor data quality
- View lineage graphs
- Set anomaly detection thresholds
5. Real-World Use Cases
Use Case 1: Financial Services – Data Compliance Auditing
- Automatically detect PII leakage or schema drift in credit risk models.
- Alert security teams of sensitive data appearing in logs.
Use Case 2: Healthcare – HIPAA Compliance
- Ensure patient records are accurate, timely, and encrypted in transit/storage.
- Track access logs and lineage of medical data through the pipeline.
Use Case 3: E-commerce – Anomaly Detection in Sales Reports
- Detect sales volume anomalies caused by failed ETL runs or incorrect data joins.
Use Case 4: DevOps Monitoring of ML Pipelines
- Monitor feature drift in ML models due to changes in data ingestion frequency.
6. Benefits & Limitations
Key Advantages
- Early detection of data quality/security issues
- Faster incident resolution with root-cause tracing
- Improved collaboration between DataOps, DevSecOps, and platform teams
- Increased confidence in data for downstream analytics and ML
Common Limitations
- Initial setup and configuration complexity
- High compute/storage cost for large-scale metadata tracking
- Risk of alert fatigue if thresholds are too sensitive
- Dependency on cooperation between data engineers and DevSecOps
7. Best Practices & Recommendations
Security Tips
- Use encrypted connections to all data sources
- Obfuscate or hash sensitive fields during profiling
- Implement role-based access controls (RBAC)
Performance and Maintenance
- Set retention policies for metadata
- Regularly prune stale or unused pipeline monitors
Compliance Alignment
- Integrate observability with data classification tools
- Generate audit trails for governance frameworks (e.g., SOC 2, ISO 27001)
Automation Ideas
- Automate data checks in CI pipelines using Great Expectations
- Trigger remediation workflows with GitHub Actions or AWS Lambda
8. Comparison with Alternatives
| Feature / Tool | Data Observability | Traditional Monitoring | Data Catalogs | APM Tools |
|---|---|---|---|---|
| Schema Monitoring | ✅ Yes | ❌ No | ✅ Partial | ❌ No |
| Data Freshness Alerts | ✅ Yes | ❌ No | ❌ No | ❌ No |
| Lineage Visualization | ✅ Yes | ❌ No | ✅ Partial | ❌ No |
| DevSecOps Integration | ✅ Strong | ✅ Moderate | ❌ Low | ✅ Strong |
Choose Data Observability When:
- You need full lifecycle visibility over your data.
- Data incidents need to be resolved as part of DevSecOps pipelines.
- You require automated anomaly detection and compliance monitoring.
9. Conclusion
Final Thoughts
Data Observability is a foundational pillar for secure, reliable, and compliant data operations in DevSecOps. By integrating observability into the CI/CD pipeline, organizations can prevent data incidents before they escalate, accelerate development cycles, and ensure continuous trust in their data products.
Future Trends
- AI-assisted data anomaly diagnostics
- Observability as code (OaC)
- Integration with large-scale data mesh architectures
Resources & Community
- OpenMetadata Docs
- Monte Carlo Data
- Datafold
- Great Expectations
- Community Slack channels and GitHub discussions
