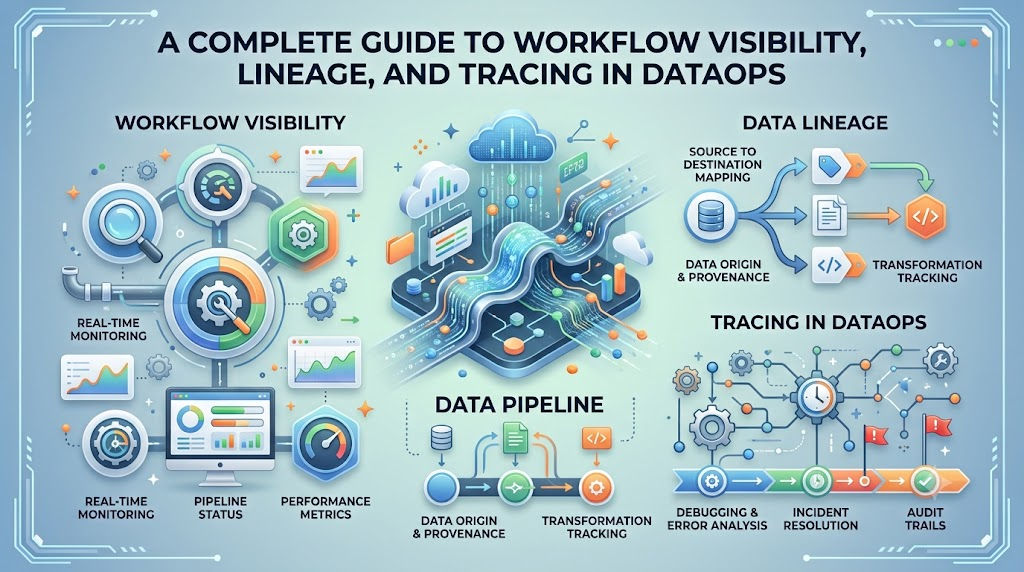
Introduction
Modern data platforms handle complex operations involving hundreds of source systems, distributed transformation jobs, and critical business dashboards. When these pipelines run without clear visibility, they act like black boxes where nobody knows what broke, why numbers changed, or who is responsible for fixing issues. DataOps workflow transparency transforms these opaque environments into clear, trackable, and understandable systems. By applying agile development, DevOps engineering principles, and statistical process controls to data lifecycle management, teams replace guesswork with automated observability, explicit lineage, and traceable operations. You can explore foundational tutorials and best practice guides directly at DataOpsSchool.com to deepen your operational engineering skills.
Understanding Workflow Transparency
Workflow transparency in a data environment means having end-to-end visibility into every stage of the data lifecycle. It is not just knowing whether an orchestration job finished with an exit code of zero. It represents deep operational clarity into the state of the data, the code executing against it, and the infrastructure supporting it.
True workflow transparency encompasses several fundamental dimensions:
- Execution Status: Real-time state of every task, batch job, streaming process, and transformation layer.
- Data Movement and Dependencies: An accurate map showing where data originates, how it is transformed, and which analytical models consume it.
- Data Quality Health: Clear indicators showing whether incoming records meet schema, nullness, freshness, and business rule expectations.
- System Ownership: Unambiguous assignment of which engineer, analytics team, or business unit owns each pipeline asset.
- Historical Change Tracking: A chronological record of every code merge, schema migration, infrastructure tweak, and configuration update.
There is a major difference between basic system monitoring and true workflow transparency. Basic monitoring merely tells you that a task failed at 03:00 AM. Comprehensive transparency explains that the task failed because an upstream operational database modified a column type, which engineer pushed the migration, and which four executive dashboards are currently serving stale data as a result.
Why Workflow Transparency Matters
When data teams operate without workflow transparency, small technical glitches rapidly escalate into organizational bottlenecks.
+-------------------------------------------------------------+
|               Opaque Data Architecture                     |
|                                                             |
|   [Sources] ---> [ ??? Unknown Transforms ??? ] ---> [BI]   |
|   - Silent bugs        - Unclear owners       - Stale Data  |
+-------------------------------------------------------------+
                              |
                     DataOps Transformation
                              v
+-------------------------------------------------------------+
|             Transparent DataOps Architecture                |
|                                                             |
|   [Sources] -> [CI/CD & Tests] -> [Lineage & Logs] -> [BI]  |
|   - Automated alerts   - Clear ownership      - Valid Data  |
+-------------------------------------------------------------+
1. Painful Troubleshooting and Delayed Incident Response
When a downstream reporting table shows incorrect metrics, engineers in low-visibility environments must manually inspect hundreds of lines of SQL, check multiple cron jobs, and ping colleagues across chat channels. This manual digging inflates the Mean Time to Detection (MTTD) and Mean Time to Resolution (MTTR).
2. Hidden Dependencies and Cascading Failures
Data pipelines naturally form directed acyclic graphs (DAGs). Without automated dependency mapping, an engineer modifying a staging model in a data warehouse might unknowingly break a machine learning feature store or a critical finance dashboard maintained by another department.
3. Unclear Ownership and Accountability
When pipelines fail without explicit ownership metadata, alerts go unaddressed because team members assume someone else is handling them. This diffusion of responsibility leads to persistent technical debt and unresolved pipeline failures.
4. Silent Data Corruption
The most dangerous data failures are not crashes—they are silent data anomalies. If a third-party payment vendor drops a field or doubles tax calculations, pipelines may complete successfully while loading corrupt figures into downstream tables. Without automated testing and observability, business teams discover these errors weeks later during financial reconciliation.
5. Audit, Compliance, and Governance Friction
Regulatory frameworks such as GDPR, HIPAA, and financial reporting standards require organizations to prove how sensitive information is processed, stored, and protected. Lacking clear version logs, access records, and lineage trails makes passing compliance audits stressful and resource-intensive.
How DataOps Enhances Workflow Transparency
DataOps bridges these visibility gaps by applying software engineering discipline and automated operational controls directly to data pipelines.
+---------------------------------------------------------------+
|               Core Pillars of DataOps Visibility              |
+-------------------------------+-------------------------------+
|  1. Observability & Quality   |  2. Lineage & Orchestration   |
|  - Freshness, Volume, Schema  |  - DAGs, Dependencies, Blast  |
|  - Automated In-Pipeline Test |    Radius & Impact Analysis   |
+-------------------------------+-------------------------------+
|  3. Version Control & CI/CD   |  4. Centralized Logs & Audit  |
|  - Git Commit History         |  - Aggregated Log Traces      |
|  - Automated Build Validation |  - Structured Run Metadata    |
+-------------------------------+-------------------------------+
Data Pipeline Monitoring and Orchestration
Modern workflow orchestrators coordinate tasks as explicit Directed Acyclic Graphs (DAGs). Instead of relying on disconnected scheduler scripts, DataOps practices mandate centralized orchestration platforms that provide a visual canvas of every workflow stage.
Engineers can inspect real-time progress, task durations, queue states, and execution histories at a glance. If a job stalls due to memory exhaustion or a network timeout, the orchestrator immediately pinpoints the exact node that failed, eliminating manual log hunting across distributed clusters.
Automated Data Lineage
Data lineage maps the journey of data from initial ingestion through intermediate transformations down to consumption points. DataOps incorporates lineage extraction tools that parse SQL queries, dbt models, Spark execution plans, and BI asset connections automatically.
[Raw Ingestion]
       │
       ▼
[Staging Cleanup] ─── (Schema Change Event)
       │
       ▼
[Analytics Core]
  ┌────┴──────────────────────────┐
  ▼                               ▼
[Customer Churn ML Model]     [Executive Revenue Dashboard]
Lineage provides two critical visibility capabilities:
- Upstream Root-Cause Tracing: When a metric looks wrong, lineage lets you trace backward to locate the exact ingestion source or transformation logic where the anomaly was introduced.
- Downstream Impact Analysis: Before refactoring or dropping a table, lineage visually displays every downstream dashboard, report, and model that depends on that asset, preventing unexpected breaking changes.
Data Observability
While traditional infrastructure monitoring tracks CPU, memory, and disk health, data observability monitors the health of the data flowing through those systems. DataOps establishes continuous evaluation across five core pillars:
- Freshness: Verifying that data lands within expected SLAs.
- Volume: Ensuring expected record counts arrive without unexplained drops or spikes.
- Schema: Detecting unexpected column additions, drops, or type alterations.
- Distribution: Checking whether values fall within expected statistical ranges, distributions, and standard deviations.
- Lineage: Correlating metric anomalies with upstream pipeline failures.
Version Control for Data Artifacts
DataOps requires storing all pipeline code, transformation models, orchestration DAG definitions, infrastructure configurations, and schema definitions in a version control system like Git.
Version control creates a permanent, immutable audit trail. Every team member can see who introduced a logic change, read the associated pull request context, understand the review discussions, and compare line-by-line diffs. If a newly deployed transformation produces unexpected numbers, the team can roll back to the last known good commit within seconds.
Continuous Integration and Continuous Delivery (CI/CD)
CI/CD pipelines automate testing and deployment workflows for data assets. Whenever an engineer submits a code change, automated CI servers spin up ephemeral environments, run static analysis (linting), compile transformation models, and execute test suites against sample datasets.
This automation prevents broken code from reaching production while providing transparent build logs. Everyone on the data platform team can inspect the automated test output to see precisely which validation checks passed or failed before code review approval.
Automated In-Pipeline Data Testing
DataOps incorporates automated data testing directly into runtime pipelines. These tests run before and after transformation jobs execute:
- Structural Assertions: Validating primary key uniqueness, foreign key integrity, and not-null constraints.
- Business Rule Assertions: Verifying that calculated fields match business logic (e.g., transaction amounts must be positive numbers).
- Statistical Assertions: Ensuring that categorical values conform to known business domains.
When a test fails, the pipeline halts execution or routes invalid rows into quarantine tables, generating a clear alert with full context rather than silently populating production datastores with faulty data.
Centralized Logging and Audit Trails
DataOps aggregates structured logs from across orchestrators, transformation engines, distributed query engines, and ingest systems into searchable, centralized logging tools.
Instead of SSHing into individual cluster worker nodes, engineers use centralized log dashboards to filter events by pipeline run ID, job name, or error code. Audit trails record every access event, schema migration, and manual parameter change, providing operational transparency for engineering reviews and governance compliance.
Practical Example: Resolving an E-Commerce Pipeline Incident
To see how DataOps workflow transparency works in practice, consider an e-commerce data pipeline that ingests daily customer transactions, cleanses the data, runs currency conversions, and updates the executive revenue dashboard.
Scenario: Currency Conversion Pipeline Failure

1. [Staging Table] ──> 2. [Currency Transform] ──> 3. [Daily Revenue Mart]
                                 │
                            [X] FAILS: Null currency_code detected
                                 │
     DataOps Transparency System Triggers:
     ├── Alert dispatched to #data-platform-alerts with direct run link
     ├── Lineage marks "Daily Revenue Mart" as STALE (prevents false reports)
     ├── Git history pinpoints yesterday's ingestion schema update
     └── Automated test quarantine isolates bad records for instant fix
The Scenario
At 04:00 AM, the transformation job responsible for converting international sales to USD fails.
Resolution Without DataOps Visibility
- The pipeline fails silently or drops an obscure error log deep inside an execution node.
- The daily revenue report dashboard refreshes with incomplete data.
- At 09:00 AM, business stakeholders notice an apparent 35% drop in overnight revenue and contact leadership in a panic.
- Engineers spend four hours manually running queries across source databases, reading raw CSV dumps, and sifting through server logs to find out what broke.
- Total resolution time: 6 hours of high-stress debugging and lost trust.
Resolution With DataOps Visibility
- At 04:01 AM, an automated in-pipeline test detects that a payment gateway sent unexpected null values in the
currency_codecolumn, causing the conversion formula to throw an exception. - The orchestrator isolates the unmapped records in an error quarantine table, pauses downstream jobs, and sends an automated Slack alert containing the exact run ID, failed model name, and error stack trace.
- The automated lineage engine marks the dependent Daily Revenue Dashboard as “Stale – Pipeline Running,” preventing executives from acting on misleading metrics.
- The on-call data engineer opens the run trace, views the failing SQL assertion, inspects recent Git pull requests to verify baseline logic, patches the currency fallback handler, and triggers an automated backfill.
- Total resolution time: 20 minutes with zero stakeholder panic.
Practical Benefits of Workflow Transparency
Adopting DataOps practices to achieve transparent workflows provides distinct engineering and business advantages:
- Drastically Reduced Mean Time to Resolution (MTTR): Pinpoint error origins, bad records, and faulty code branches in minutes instead of hours.
- Higher Data Trust Across the Organization: Business users and analysts gain confidence in reports because pipeline health, update timestamps, and known issues are visible.
- Frictionless Cross-Team Collaboration: Data engineers, analytics engineers, and data scientists collaborate using shared lineage maps, standardized code repositories, and common documentation.
- Simplified Change Management: Engineers can refactor queries, alter database schemas, and upgrade pipeline infrastructure with confidence by assessing downstream blast radius first.
- Efficient Regulatory Compliance: Maintain detailed, queryable audit logs of data provenance, access histories, and transformations for security and privacy reviews.
Challenges and Limitations in Practice
Achieving complete DataOps workflow transparency requires realistic planning and overcoming specific organizational hurdles:
- Tool Fragmentation and Sprawl: Modern stacks often mix diverse technologies (e.g., Snowflake, dbt, Airflow, Spark, Kafka). Integrating lineage, monitoring, and logging across these heterogeneous systems demands deliberate architecture and integration effort.
- Alert Fatigue: Setting up too many noisy, non-actionable alerts causes on-call engineers to ignore notifications. Alerts must be calibrated to notify teams only when meaningful action is required.
- Incomplete or Dynamic Lineage Gaps: Extracting lineage from complex, dynamically generated SQL queries or external proprietary third-party systems can be difficult and may require specialized metadata parsers.
- Cultural and Process Resistance: Workflow transparency makes code quality, test coverage, and engineering performance visible. Transitioning teams to shared Git reviews and automated testing requires supportive engineering leadership.
Best Practices for Improving Workflow Transparency
To build reliable, transparent data workflows, adopt the following practical guidelines:
- Establish Explicit Data Asset Ownership: Tag every pipeline, dbt model, and dashboard with an explicit owner (e.g.,
owner: analytics-team-core). Ensure alerts route directly to responsible team channels. - Standardize Naming and Metadata Conventions: Enforce consistent naming for pipeline stages, dataset aliases, and task identifiers across all orchestrators and transformation tools.
- Embed Automated Tests at Every Stage: Implement structural tests at ingestion, semantic tests during transformation, and reconciliation checks before loading to production datastores.
- Implement Centralized, Searchable Logging: Ensure every orchestrator run passes consistent execution IDs to transformation engines and query warehouses for frictionless trace filtering.
- Enforce Version Control and Peer Reviews: Require all pipeline code, SQL scripts, and DAGs to pass automated CI tests and peer review before merging to production branches.
- Publish Data Health Dashboards: Make pipeline status, SLA compliance, and data freshness accessible to data analysts and business stakeholders through shared status pages.
- Document Critical Dependencies Regularly: Maintain clear DAG documentation and automated lineage models, reviewing unmapped pipeline paths during technical debt sprints.
Future Trends in Workflow Transparency
Workflow transparency continues to evolve alongside advances in automation and platform engineering:
- AI-Assisted Root-Cause Diagnostics: Machine learning models integrated into observability platforms will automatically parse stack traces, query histories, and recent pull requests to draft root-cause summaries and suggest code fixes during outages.
- Autonomous Lineage Discovery: Next-generation metadata engines will construct accurate column-level and cell-level lineage by analyzing runtime query execution logs without requiring manual tagging or plugin maintenance.
- Self-Healing Data Pipelines: Systems will detect anomalies in real time, quarantine problematic micro-batches, and dynamically trigger auto-remediation routines or fallback transformation logic without human intervention.
- Unified Observability Control Planes: Fragmented data stacks will consolidate operational metrics, data quality logs, security policies, and cost attribution metrics into unified, developer-friendly dashboards.
FAQs
- What does workflow transparency mean in DataOps?
Workflow transparency in DataOps refers to complete operational visibility into every phase of the data pipeline lifecycle. It ensures that engineers and analysts can see pipeline health, data movement paths, transformation logic, dependency trees, quality test results, and change history in real time.
- How does DataOps differ from traditional data pipeline monitoring?
Traditional monitoring only tracks infrastructure metrics like CPU usage or whether a scheduled job succeeded or failed. DataOps transparency goes further by evaluating data quality, column-level lineage, schema drift, record volume anomalies, code version changes, and downstream business impacts.
- Why is data lineage essential for transparent workflows?
Data lineage maps how data travels from source systems through transformations to downstream dashboards and models. It allows engineers to trace data errors back to their exact origin and evaluate the downstream blast radius before modifying existing pipelines.
- How does automated testing enhance pipeline visibility?
Automated testing evaluates incoming and transformed data against structural and business logic rules. When an anomaly occurs, tests catch the error immediately and pinpoint the exact records and logic that failed, preventing silent data corruption.
- What role does version control play in DataOps transparency?
Version control tracks every code, configuration, and schema modification in a centralized repository. It creates a complete history of what was changed, by whom, and why, enabling straightforward code reviews, auditability, and fast rollbacks when bugs occur.
- How does data observability prevent silent data failures?
Data observability continuously monitors metrics across freshness, volume, distribution, schema, and lineage. It alerts teams to subtle anomalies—such as a sudden drop in daily row counts or invalid categorical values—even when underlying batch jobs complete without syntax errors.
- What is the difference between upstream and downstream visibility?
Upstream visibility allows you to look backward from a report or metric to see the source systems and transformations that created it. Downstream visibility allows you to look forward from a data table to identify all reports, ML models, and teams that depend on that specific asset.
- How can small data teams begin implementing DataOps transparency?
Small teams should start by putting all pipeline code and transformation models into a shared Git repository, adding basic automated schema and null-value tests in their transformation layer, and establishing explicit Slack alerts for orchestrator task failures.
- What causes alert fatigue in data pipeline monitoring, and how can it be fixed?
Alert fatigue occurs when teams configure too many noisy, non-actionable alerts for minor fluctuations. It can be resolved by setting sensible statistical thresholds, testing for true business impact, and routing alerts directly to specific, designated asset owners.
- How does workflow transparency improve collaboration between engineers and business analysts?
Transparency provides shared visibility into data freshness, pipeline health, and known issues. When analysts can independently check whether a pipeline ran successfully and verify data definitions, it eliminates constant status check meetings and builds organizational trust in data.
Conclusion
DataOps workflow transparency transforms fragile, black-box pipelines into resilient, observable, and trustworthy data systems. By integrating modern orchestration, automated testing, comprehensive data observability, continuous lineage mapping, and disciplined version control, teams eliminate guesswork and streamline daily operations. Investing in visibility enables data teams to catch silent anomalies before they impact decision-makers, resolve operational incidents in minutes rather than days, and scale their data architectures with clarity and confidence.
