Introduction
In the modern enterprise landscape, decisions are only as good as the data driving them. Yet, many data teams spend up to 80% of their time firefighting broken tables, dealing with unexpected schema changes, and manually running scripts to fix stale dashboards. Building a data pipeline is no longer just about moving bytes from point A to point B; it is about doing so with absolute predictability, speed, and continuous trust. DataOps emerges as the vital missing discipline for modern data operations. By infusing software engineering best practices—like continuous testing, modular architecture, and automated deployments—into data workflows, DataOps bridges the gap between raw infrastructure and rapid, reliable analytics. To help data professionals master these critical engineering skills, platforms like DataOpsSchool.com offer hands-on training built around these operational standards. In this practical guide, you will learn exactly how to build a basic DataOps pipeline from scratch, turning a fragile data flow into an automated, self-healing data engineering workflow.
What Is a DataOps Pipeline?
A DataOps pipeline is an automated, highly observed data delivery mechanism that applies agile engineering, continuous integration/continuous delivery (CI/CD), and automated quality testing to the end-to-end data lifecycle. Unlike a traditional data pipeline, which focuses exclusively on the mechanical path of data movement, a DataOps pipeline treats both the data and the pipeline code as a unified product.
Traditional Data Workflow:  [Code Change] ──> (Manual Deploy) ──> [Run Raw Pipeline] ──> (Production Outage)

DataOps Pipeline Workflow:   [Code Change] ──> [Auto CI/CD Test] ──> [Auto-Deploy] ──> [Data Quality Gate] ──> [Healthy Data]
The core purpose of a DataOps pipeline is to shorten the data analytics lifecycle while simultaneously elevating data quality. It is built around three foundational pillars:
- Automation: Eliminating human touchpoints across scheduling, deployment, and error recovery.
- Continuous Testing: Validating formatting, freshness, and values at every single stage of transit.
- Observability: Providing immediate, proactive alerts on pipeline health before downstream users notice an issue.
DataOps vs. Traditional Data Workflows
| Characteristic | Traditional Data Workflow | Modern DataOps Pipeline |
| Deployment Mode | Manual server updates and ad-hoc script execution. | Fully automated through code repositories and CI/CD tools. |
| Testing Strategy | Downstream verification (finding bugs after data hits reports). | Proactive, automated data quality gates built into the pipeline flow. |
| Error Handling | Silent failures or manual system logs inspection. | Real-time automated alerting and self-healing mechanisms. |
| System Coupling | Monolithic setups where a single break stops the whole system. | Decoupled, modular architecture using cloud-native engines. |
Understanding the Core Components of a DataOps Pipeline
To design an adaptable data pipeline architecture, you must understand the individual modules that process, protect, and move your enterprise data.
Data Sources
Data sources represent the origin layer where information is generated. These can include transactional relational databases (like PostgreSQL), cloud-native application APIs (like Salesforce or Stripe), third-party webhooks, flat file drops (like CSV or JSON files inside SFTP servers), or real-time event streaming queues.
Data Ingestion
The ingestion engine extracts raw data from the sources and delivers it to a landing zone. In modern systems, this is highly automated to support either scheduled micro-batches or event-driven ingestion, ensuring that changes in source structures do not silently crash the pipeline.
Data Transformation
Raw data is rarely ready for business consumption. The transformation layer cleanses, reshapes, deduplicates, and aggregates raw tables into clear business metrics. Modern DataOps pipelines extensively favor the ELT (Extract, Load, Transform) pattern, executing transformations directly inside the target data platform to exploit its scalable computing engine.
Data Validation
This component acts as the quality gatekeeper of your architecture. Data validation runs automated test assertions against the data in real time. If a batch contains invalid null values, duplicate primary keys, or broken formatting, the validation layer blocks the bad data from moving forward.
Data Storage
The centralized repository where data is organized. This typically takes the form of a cloud data warehouse or an integrated lakehouse architecture. Data is separated into distinct processing layers—often structurally split into raw, conformed, and production-ready reporting layers.
Monitoring and Observability
The control plane that continuously tracks pipeline execution speeds, row counts, volume deviations, and API connection health. It ensures complete operational visibility and broadcasts instant notifications to Slack, PagerDuty, or email if an exception occurs.
Reporting and Analytics
The final destination layer where business intelligence (BI) platforms, data science environments, or operational reverse-ETL applications consume the fully validated, transformed data to drive strategic decisions.
Why Organizations Need DataOps Pipelines
Relying on legacy, unmonitored data flows creates an invisible drag on an organization’s performance. Adopting automated data pipelines unlocks several key competitive advantages:
- Faster Analytics Delivery: By eliminating manual deployments and environment creation, teams safely move new metrics from development to production in minutes instead of weeks.
- Predictable Data Quality: Continuous testing catches data corruption immediately upon ingestion, stopping broken files from ever reaching executive dashboards.
- Drastically Reduced Manual Effort: Engineers stop spending their mornings manually running SQL scripts or rebuilding broken tables, freeing up time to build new strategic features.
- Elastic Scalability: Decoupled cloud-native storage and compute handle massive jumps in data volume without requiring architecture overhauls.
- Stronger Cross-Team Collaboration: Shared software-driven methodologies allow data analysts, analytics engineers, and data scientists to work out of a unified version-controlled repository without overriding each other’s work.
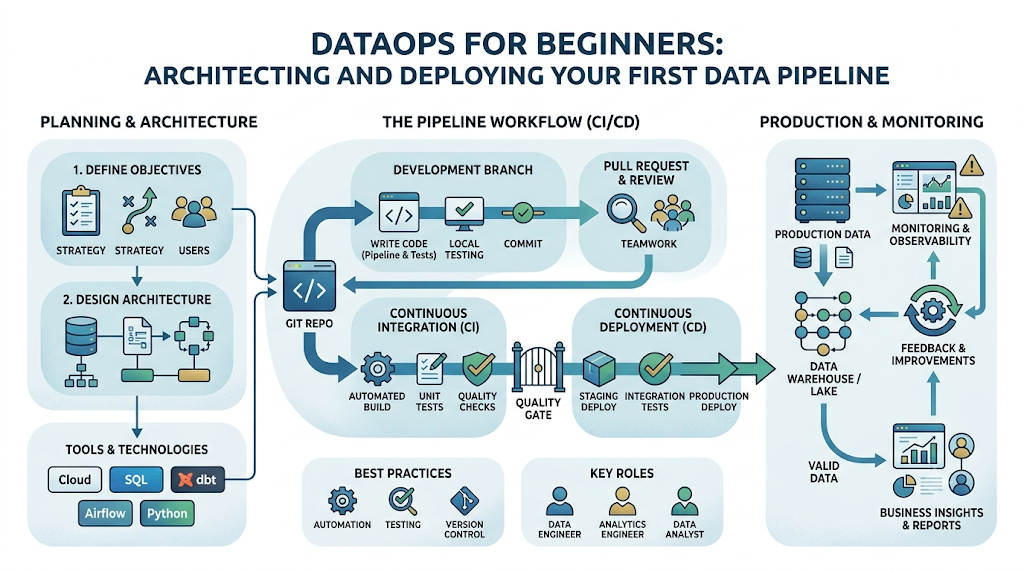
Architecture of a Basic DataOps Pipeline
A successful DataOps implementation connects data layers sequentially, using continuous monitoring and validation as a protective envelope around every single transaction.
[Data Sources]
       │
       ▼
 [Ingestion Layer]     ─── (Loads raw storage)
       │
       ▼
[Transformation Layer] ─── (Applies business logic via modular SQL)
       │
       ▼
 [Validation Layer]    ─── (Runs assertions; blocks bad schemas)
       │
       ▼
  [Storage Layer]      ─── (Structured reporting schemas)
       │
       ▼
 [Analytics Layer]     ─── (BI dashboards / Data consumption)
       │
  ▲▲▲▲▲▲▲▲▲▲▲
  └─── [Monitoring & Observability Layer] (Tracks all phases in real time) ───┘
The Workflow Layers in Action
- Data Sources: Production systems generate events, log files, or database rows.
- Ingestion Layer: An automated tool connects to sources, extracts data, and drops it into a secure storage landing zone without altering schemas.
- Transformation Layer: Distributed query engines or transformation frameworks structure raw strings into typed columns, clean up dates, and apply business filters.
- Validation Layer: Automated test scripts verify that column values and structures conform exactly to expected rules.
- Storage Layer: The validated data is committed to clean production schemas, ready for business queries.
- Analytics Layer: BI tools read clean data, ensuring dashboards remain accurate and updated.
- Monitoring Layer: A metadata track monitors performance metrics across every step, logging execution times and data health profiles.
Step-by-Step Guide to Build a Basic DataOps Pipeline
Building your first automated pipeline requires clear execution across consecutive steps. Let’s walk through the exact process to take a pipeline from initial design to automated deployment.
1.Step 1: Define Business Requirements:Prerequisite Phase.
Before writing any code, establish the explicit downstream use case and define target service level agreements (SLAs). Know how fresh the data needs to be and what specific columns the business actually needs.
Example: A marketing team requires an automated dashboard refreshed every morning at 6:00 AM to review previous-day ad spend metrics across multiple ad platforms.
Common Mistake: Building a pipeline based on technical curiosity without concrete column requirements, resulting in bloated processing costs and unutilized data.
2.Step 2: Identify Data Sources:Discovery Phase.
Locate the authoritative systems holding your source data. Request read-only access credentials and secure API keys, and explicitly map out the original schemas, data types, and update frequencies.
Example: Identifying that target customer transaction rows live inside a production PostgreSQL database table, updated continuously via an auto-incrementing primary key.
Common Mistake: Blindly hitting live transactional production databases with heavy, non-indexed analytical queries, which can degrade app performance for real users.
3.Step 3: Design Data Flow:Architecture Blueprinting.
Document the end-to-end lineage map showing exactly where data enters, where it lands, how it transforms, and where it ultimately resides. Choose your processing pattern (typically ELT for cloud environments).
Example: Creating a clear architecture diagram detailing how data travels from a database, lands as flat JSON files in cloud object storage, and finishes inside a data warehouse.
Common Mistake: Failing to sketch data flows beforehand, leading to circular table dependencies and messy data lineages that are nearly impossible to debug.
4.Step 4: Build Data Ingestion Processes:Implementation Phase.
Set up automated connectors to pull change data or scheduled increments from your sources. Avoid building custom scripts whenever native configurations can extract and load the data instead.
Example: Configuring an automated sync tool to copy new rows from an operational database into your raw landing warehouse tables every hour on the hour.
Common Mistake: Writing fragile, hard-coded custom Python extraction scripts that break completely whenever an external vendor adds or removes an API property.
5.Step 5: Implement Data Transformation Logic:Development Phase.
Write modular, version-controlled SQL statements or code modules to process raw strings into clean analytical records. Utilize a modern transformation tool that builds dependencies automatically.
Example: Constructing a SQL model that casts text timestamp fields into proper UTC date formats and filters out internal test account transactions.
Common Mistake: Writing giant, 2,000-line monolithic SQL queries with endless nested subqueries, which are slow to run and incredibly painful to troubleshoot.
6.Step 6: Add Data Quality Checks:Testing Integration.
Embed automated validation checks directly into your transformation run. Define explicit assertions that data must pass before it is pushed into production storage views.
Example: Adding automated configuration rules confirming that a customer_id column contains zero null values and that the order_amount is always a positive number.
Common Mistake: Treating data testing as a secondary downstream check, allowing corrupted, zero-row files to silently clear and break customer dashboards.
7.Step 7: Configure Data Storage:Infrastructure Setup.
Structure your storage warehouse into isolated execution environments and layered schemas (such as raw ingestion schemas, testing staging areas, and production presentation tables).
Example: Pointing your raw pipeline exclusively into a protected dev_raw_marketing schema for local isolation before code verification.
Common Mistake: Letting development pipelines read and write directly into live production database schemas, risking accidental table drops or data loss.
8.Step 8: Implement Monitoring:Observability Setup.
Configure system health tracking and error notifications. Connect automated webhooks to instantly ping engineers whenever jobs time out, fail validation checks, or experience volume anomalies.
Example: Setting up a monitoring webhook that alerts your team’s Slack channel with the exact error log the second an ingestion run encounters a connection failure.
Common Mistake: Route pipeline error alerts to an unmonitored email inbox, letting critical infrastructure failures go completely unnoticed for days.
9.Step 9: Automate Deployment:CI/CD Integration.
Move your code out of local desktop environments and place it into a Git repository. Set up automated workflow engines to run syntax checks and unit tests before any change merges into production.
Example: Establishing a GitHub Actions workflow that automatically executes data schema tests on isolated pull requests before updating code on production orchestrators.
Common Mistake: Manually copying, pasting, and running updated SQL transformations straight into a production UI from a local desktop machine.
10.Step 10: Continuously Improve the Pipeline:Lifecycle Optimization.
Periodically review your pipeline metrics, processing costs, query speeds, and error logs. Optimize query performance and update tests as data volumes expand.
Example: Profiling query performance to identify a slow table scan, then applying cluster keys or indexing patterns to drop compute times from hours to minutes.
Common Mistake: Assuming a production pipeline requires no maintenance once deployed, causing gradual performance slowdowns and ballooning compute bills over time.
Tools Commonly Used in DataOps Pipelines
Modern data operations rely on specialized components grouped across functional layers. Selecting the right stack ensures your engineering workflow scales effortlessly.
| Category | Primary Purpose | Popular Tools |
| Data Ingestion | Extracts data safely from APIs and operational databases into storage. | Airbyte, Fivetran, Meltano |
| ETL / ELT Platforms | Transforms, cleanses, and structures raw data profiles via SQL/code. | dbt (Data Build Tool), SQLMesh, Apache Spark |
| Orchestration | Coordinates workflow timing, task dependencies, and scheduling. | Apache Airflow, Prefect, Dagster |
| Data Quality | Runs automated validation rules and schema assertions against tables. | Great Expectations, Soda, dbt-test |
| Monitoring | Provides deep runtime observability, column lineage, and alert systems. | Monte Carlo, Datadog, OpenLineage |
| Collaboration | Manages version control, code review, and automated CI/CD deployments. | GitHub, GitLab, Bitbucket |
Best Practices for Building DataOps Pipelines
To ensure your data engineering workflow remains resilient as data volumes scale, embed these foundational practices into your design:
The Golden Rule of DataOps: Treat your data infrastructure as code. Never make ad-hoc modifications to schemas or schedules straight within a production database console.
- Automate Wherever Possible: Every single manual step is a vector for human error. Automate your orchestration triggers, security updates, schema changes, and reporting refreshes.
- Monitor Pipeline Health Proactively: Move past basic success/failure tracking. Implement volumetric monitoring to capture anomalies—like receiving 50 rows when the typical daily ingestion is 50,000 rows.
- Implement Continuous Testing: Run test criteria on data in flight. Isolate raw rows, run formatting validation, and explicitly ensure business-critical rules match before allowing values to load into production tables.
- Document Pipeline Workflows Dynamically: Avoid relying on stale Markdown files or outdated wiki pages. Rely on tools that generate interactive column lineage maps and data catalogs directly from your pipeline code.
- Design Separated Scalability: Keep your data extraction logic completely detached from your analytical computation logic. This prevents an external API slowdown from pausing or freezing internal reporting processes.
- Prioritize Data Quality at the Source: Catch schema violations and formatting discrepancies as close to the ingestion boundary as possible to prevent error propagation across downstream systems.
Common Challenges and Solutions
1. Data Quality Issues
- The Challenge: Source operational platforms frequently alter schema names, drop columns, or input invalid data types without alerting the data team, breaking downstream models.
- The Solution: Deploy automated schema validation checks at the ingestion perimeter. If an unexpected format change appears, isolate the data in a staging area and alert engineering before it can alter production storage.
2. Pipeline Failures
- The Challenge: Temporary network drops, third-party API rate limits, or database connection timeouts can abruptly kill running pipeline scripts mid-transaction.
- The Solution: Configure your orchestration tool with intelligent retry patterns and automated backoff limits. Implement atomic database updates so partial pipeline runs never write duplicate or corrupted records.
3. Performance Bottlenecks
- The Challenge: As business volume increases, processing large historical tables sequentially causes data latency to swell, resulting in delayed morning analytics.
- The Solution: Transition from full table rebuilds to incremental loading processing models. Partition large data sets by date attributes and leverage cluster indexes to scan only the newest records.
4. Governance Concerns
- The Challenge: Unmonitored pipelines can unintentionally pull sensitive data—like personally identifiable information (PII)—into open analytical tables, violating compliance standards.
- ,The Solution: Integrate masking functions, column-level access rules, and automated tagging frameworks inside the transformation layer to isolate and restrict sensitive data views.
5. Team Collaboration Problems
- The Challenge: Multiple analytics developers updating production models simultaneously can overwrite code changes, causing unpredictable behavior.
- The Solution: Mandate a version-controlled Git workflow requiring isolated staging environments for every branch, accompanied by peer reviews before any code updates are merged.
Real-World Use Cases
Business Intelligence Reporting
Automated data pipelines collect daily operational events across isolated systems, transforming them into structured dimensional models. This guarantees executives read reliable historical reports every single morning with complete metric accuracy.
Customer Analytics
By syncing touchpoints across user platforms, support systems, and internal product interactions into a unified view, teams evaluate churn patterns and customer health indicators using continuously updated data profiles.
Financial Reporting
Automated flows securely combine ledger transactions, billing logs, and payroll runs into strict, highly auditable structures. Integrated data validation ensures balances perfectly reconcile, completely removing manual spreadsheet errors.
E-Commerce Analytics
Pipelines orchestrate inventory updates, shopping cart actions, and delivery milestones. Volumetric alerts immediately flag sudden drops in checkout data, allowing technical teams to quickly spot and fix payment processing issues.
Marketing Performance Tracking
Data operations cleanly consolidate varying spend structures across disparate ad channels. Marketers analyze true customer acquisition costs and optimize live campaigns without spending hours manually cleaning CSV files.
Measuring Pipeline Success
To evaluate the maturity and performance of your DataOps implementation, track these key metrics:
- Data Freshness (Latency): The total time elapsed from when an operational event occurs to when that record becomes queryable inside your production reporting layer.
- Pipeline Reliability (Uptime): The percentage of scheduled pipeline runs that execute successfully without encountering critical unhandled errors.
- Processing Speed (Execution Duration): The time required to run ingestion, processing, and transformation modules across a standard data volume batch.
- Error Rates: The frequency of bad data rows or schema exceptions tripped by validation layers relative to the overall volume processed.
- Business Impact: The measurable acceleration in data team delivery velocity and the drop in analytics bugs reported by business stakeholders.
Career Benefits of Learning DataOps
As data environments grow increasingly complex, the market value of traditional data professionals who rely on manual, fragile processes is declining. Transitioning into data automation opens up highly rewarding specialized careers:
- DataOps Engineer: Focuses entirely on the continuous deployment, developer environments, and architectural tools that empower data teams.
- Analytics Engineer: Sits at the intersection of business intelligence and data engineering, writing clean, version-controlled transformation logic and automated testing schemas.
- Data Platform Engineer: Builds and manages the scalable infrastructure—like distributed storage and cloud engines—that powers modern data operations.
- Data Architect: Blueprints the comprehensive governance frameworks, ingestion patterns, and layout maps that dictate enterprise data flows.
- Data Reliability Engineer: Dedicated to maintaining high availability, monitoring systems, tracing data lineage, and optimizing system uptime across pipelines.
Future of DataOps Pipelines
The next evolution of data engineering focuses heavily on removing operational friction:
- AI-Driven Data Operations: Machine learning models will automatically map source changes to target destinations, suggesting code refactors when schemas evolve.
- Deep Data Observability Expansion: Monitoring systems will transition from basic validation assertions to end-to-end operational visibility, tracing column-level dependencies down to single fields.
- Self-Healing Pipelines: When an ingestion job encounters a broken record format, autonomous architectures will isolate the error and re-route traffic without needing manual human triage.
- Cloud-Native Architectures: Processing models will leverage highly decoupled serverless layers that auto-scale compute dynamically on an execution-by-execution basis.
- Autonomous Data Workflows: Intelligent orchestrators will dynamically re-order task sequences in real time based on cluster loads and resource efficiency.
Common Misconceptions About DataOps Pipelines
Misconception 1: “DataOps is just a fancy name for DevOps.”
The Reality: While DataOps shares core principles with software DevOps (like version control and CI/CD), it addresses unique data challenges. DevOps manages static code compilation; DataOps must manage code changes plus unpredictable, ever-shifting raw data values flowing through that code.
Misconception 2: “DataOps can be implemented simply by purchasing a specific tool.”
The Reality: DataOps is a culture and an operational methodology, not a software license. True optimization stems from team discipline around testing, automated deployment workflows, and clear architecture standards—no individual tool instantly provides this out of the box.
Misconception 3: “Only massive tech giants with petabyte-scale data need DataOps.”
The Reality: Even a small startup managing a few simple spreadsheets can suffer from broken pipelines and incorrect dashboard metrics. Implementing basic automated testing and version control saves time and prevents errors, regardless of your overall company size.
FAQ Section
1. What is the difference between ETL and ELT in modern data pipelines?
ETL transforms data on an external server before saving it to a target destination, which can create processing bottlenecks. ELT saves raw data directly to a cloud data warehouse first, utilizing the warehouse’s own scalable computing power to perform transformations much faster.
2. Can a beginner build a DataOps pipeline without an advanced software engineering background?
Yes. Modern data ingestion and transformation tools allow anyone with a solid understanding of SQL and basic version control concepts to configure automated, resilient pipelines without writing thousands of lines of complex python backend code.
3. How often should a basic DataOps pipeline run data quality checks?
Data quality checks should run continuously on every pipeline execution. Validation rules should trigger immediately after raw ingestion to verify formatting, and run again following your transformation steps to confirm business rules match.
4. What happens when a DataOps pipeline detects corrupted data?
A properly configured DataOps pipeline will halt the broken transaction batch or isolate the corrupted rows into a separate quarantine table. This triggers an automated Slack or email alert to engineers while letting healthy data pass through unhindered.
5. Why is version control like Git necessary for data analysts and data engineers?
Git creates a clear history of every single change made to your pipeline code and transformation logic. It allows teams to work safely on isolated code branches, perform structured peer reviews, and easily roll back changes if a production issue arises.
6. Is Apache Airflow too complex for a basic beginner data pipeline?
While Apache Airflow is extremely powerful, its deployment and maintenance overhead can be steep for beginners. For a basic pipeline, lighter modern orchestrators like Dagster, Prefect, or cloud-managed workflow engines are often easier to learn and set up.
7. How do schema changes affect automated data pipelines?
Unannounced schema changes are a primary cause of pipeline failures. A DataOps pipeline handles this by utilizing automated schema evaluation steps that gracefully pause executions or route data to safe staging areas before bad columns can corrupt clean production tables.
8. What is data observability and how does it differ from simple system monitoring?
System monitoring tracks basic technical states like “Did the script succeed or fail?” Data observability goes deeper by evaluating the health of the actual data inside the system—flagging things like unusual row counts, extreme null rate spikes, or data drift over time.
9. Can open-source tools be used to build a production-grade DataOps pipeline?
Absolutely. The modern data stack contains powerful open-source tools across every single layer, including Airbyte for ingestion, dbt Core for transformation, Great Expectations for validation, and Prefect for orchestrating workloads.
10. How long does it typically take to transition a legacy data pipeline to a DataOps model?
A complete overhaul can take months, but transitioning is best done incrementally. Start by adding a single automated test to your most critical table, then put your SQL under version control, and gradually add automation features over time.
Final Summary
Building a basic DataOps pipeline means moving away from fragile, manual data tasks and adopting a reliable, software-focused engineering workflow. By introducing automated ingestion, continuous testing, modular transformations, and real-time monitoring, you build data systems that scale seamlessly while remaining highly accurate. The secret to mastering data pipeline automation is hands-on implementation. Put your code into version control, embed quality validation rules from the start, and learn to automate your workflows step-by-step.