Introduction
In the modern business landscape, data is everywhere. Every click, sale, and customer interaction generates valuable information. However, raw data by itself is like unrefined oil; it holds immense potential but is practically useless until it is processed. To stay competitive, companies need fast access to reliable information. This is where the concept of time-to-insights becomes critical. When organizations reduce the time it takes to turn raw data into actionable knowledge, they can make quicker, more informed choices. Imagine a retail store that can see immediately which products are selling out during a sudden flash sale. They can restock those items before losing potential revenue. On the other hand, if it takes weeks to analyze that sales data, the opportunity vanishes. Accelerating this cycle is one of the biggest challenges facing modern business intelligence and data analytics teams. Data pipelines are often complex, brittle, and prone to breaking. DataOps offers a modern approach to fixing these bottlenecks, ensuring that high-quality data flows smoothly from source to dashboard without unnecessary delays.
What Is DataOps?
DataOps, short for Data Operations, is a collaborative methodology designed to improve the quality and reduce the cycle time of data analytics. It is not just a single software tool or a specific piece of technology. Instead, it is a mix of mindsets, cultural shifts, and technical practices borrowed from DevOps—the system software developers use to build and deploy applications rapidly.
Core Principles of DataOps
- Continuous Delivery: DataOps focuses on delivering small, frequent, and reliable updates to data pipelines rather than massive, risky updates once every few months.
- Automation: By automating repetitive manual tasks, teams minimize human error and speed up data movement.
- Collaboration: It tears down the invisible walls separating data engineers, data scientists, analysts, and business users.
- Quality Control: Testing occurs at every stage of the pipeline, ensuring that errors are caught immediately before they reach final reports.
The Goals of DataOps
The primary goal of DataOps is to make data management predictable, transparent, and highly scalable. In modern data management, DataOps acts as the factory conveyor belt. It ensures that raw information enters the factory, undergoes strict automated inspection, changes into a usable format, and arrives at the consumer’s desk perfectly intact and right on time.
3. What Is Time-to-Insights?
Time-to-insights is the total duration of time it takes for an organization to collect raw data, process it, analyze it, and extract a meaningful trend or fact that can guide a business decision.
[Raw Data Collected] ---> [Processing & Cleaning] ---> [Analysis & Reporting] ---> [Business Insight]
|<--------------------------------- Time-to-Insights --------------------------------->|
Why It Matters and Its Business Value
In the digital age, market conditions shift rapidly. The business value of an insight degrades over time. An insight delivered six months late is no longer an asset; it is history. Reducing time-to-insights means giving business leaders the ability to respond to market shifts in minutes or hours rather than weeks or quarters.
Delayed vs. Fast Insights: A Quick Scenario
- Delayed Insights: A telecommunications company notices a drop in user engagement. Because their data engineering processes are manual, it takes four weeks to gather logs from different servers, clean the files, and update the analytics dashboards. By the time the business analysts see the report, thousands of customers have already switched to a competitor.
- Fast Insights: The same company uses an automated system. Within hours of the engagement drop, an automated data pipeline triggers an alert. The analysts instantly see that a specific app update is causing crashes. The development team fixes the bug the same day, saving the company from losing valuable subscribers.
Why Faster Time-to-Insights Is Important
Accelerating the speed at which you understand your data provides major foundational advantages across an organization.
Better Decision-Making
When leaders base choices on fresh, current data, their strategies are naturally more accurate. They no longer rely on guesswork or gut feelings from the previous month’s performance.
Improved Customer Experience
If a customer experiences an issue on a website or app, fast insights allow support and product teams to detect the friction point immediately. Issues can be resolved before they turn into widespread customer complaints.
Faster Innovation
Testing new features, products, or marketing strategies requires rapid feedback loops. When data analytics workflows are swift, teams can run experiments, view the results, alter their plans, and launch new ideas much quicker.
Competitive Advantage
In crowded markets, the company that adapts first wins. Being able to spot an emerging consumer trend days before your competitors gives you a clear head start in capturing market share.
Operational Efficiency
Automating the path from raw data to a dashboard eliminates thousands of hours of tedious manual tasks for data engineers. This frees them up to work on higher-value projects.
Reduced Business Risks
Whether it is detecting fraudulent credit card transactions or spotting a supply chain bottleneck, rapid insights allow risk management teams to take preventative action before minor issues balloon into costly disasters.
How DataOps Improves Time-to-Insights
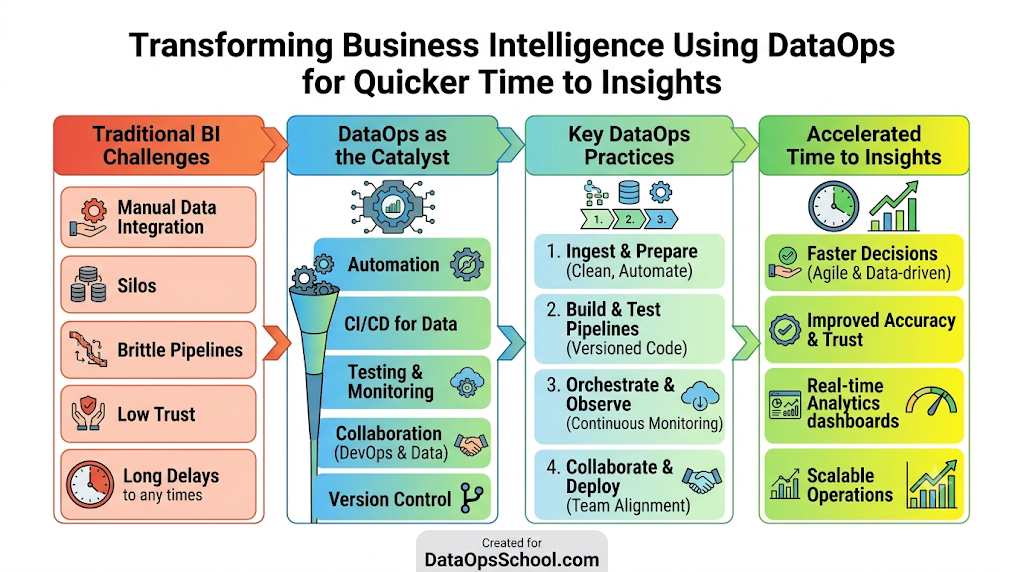
DataOps solves data delivery delays by reinventing every major phase of the modern data pipeline. Here is a step-by-step breakdown of how it accelerates the process.
[1. Streamlined Ingestion]
          ↓
[2. Automated Pipelines & Orchestration]
          ↓
[3. Continuous Validation & Quality Monitoring (Observability)]
          ↓
[4. Automated Reporting & Real-Time Analytics]
Data Ingestion and Automated Data Pipelines
Traditionally, moving data from a database into an analytical storage area required building custom, brittle code scripts by hand. DataOps introduces automated data pipelines. These pipelines use pre-built connectors and automated ingestion tools to pull data from diverse sources continuously, reducing data engineering backlogs.
Data Validation and Continuous Testing
Errors in data frequently stall the analytics workflow. If a file arrives with missing numbers or mixed-up dates, the final dashboard breaks, forcing analysts to wait days for a fix. DataOps uses continuous testing. Just like code is tested in software engineering, data is validated automatically as it flows through the pipeline. If a file looks incorrect, the system flags it instantly.
Data Quality Monitoring and Pipeline Orchestration
Data quality monitoring tools watch over data flows to verify accuracy and compliance. This sits closely with pipeline orchestration, which acts like an automated traffic controller. Orchestration software ensures that step B in a workflow starts the exact second step A finishes successfully, eliminating dead time between jobs.
Data Observability
Data observability goes beyond basic monitoring. It gives data engineers complete visibility into the health of their systems. If a data pipeline slows down or a table stops updating, observability tools pinpoint the exact cause of the failure, allowing teams to repair it before business users even notice a glitch.
Automated Reporting, Dashboard Updates, and Real-Time Analytics
Instead of waiting for an engineer to manually refresh an old database at the end of the week, DataOps-driven architectures support real-time analytics. Dashboards pull live or near-live information automatically. This means business intelligence professionals always look at real-time reality rather than historical summaries.
Core DataOps Practices That Speed Up Analytics
To make data operations run smoothly and consistently, teams implement several vital practices:
- Workflow Automation: Eliminates human intervention for routine tasks like moving files, scheduling extraction jobs, and scaling server infrastructure.
- CI/CD (Continuous Integration/Continuous Deployment) for Data Pipelines: When a data engineer updates a pipeline script, the changes are automatically tested and safely deployed without knocking the entire analytics environment offline.
- Collaboration: DataOps relies on shared communication platforms and unified tools so that data engineers, scientists, and business users can design pipelines together rather than working in isolated silos.
- Metadata Management: Keeping organized records about what your data means, where it lives, and who owns it allows analysts to find the right information instantly.
- Data Lineage: This creates a visual map showing the complete journey of data from its origin to the final chart. If a number looks wrong on a report, an analyst can trace it backward instantly to see where it changed.
- Version Control: Using systems like Git to track every single change made to database queries and pipeline code ensures that if a new update breaks something, the team can roll it back to a working version with one click.
- Continuous Improvement: Teams regularly review pipeline performance metrics to find bottlenecks, constantly tweaking the system to shave minutes or hours off processing times.
Benefits of DataOps for Faster Insights
Implementing DataOps brings clear, measurable advantages to the whole enterprise.
Reduced Data Processing Time
By eliminating manual data prep and sluggish legacy batch schedules, data moves from production systems to end-user reports much faster.
Higher Data Quality and Increased Trust
Because automated tests filter out dirty or corrupt records early, the final dashboards remain accurate. When business teams notice that reports match reality perfectly day after day, their trust in data increases, ending long debates over whether a chart is correct.
Faster Reporting and Better Productivity
Analysts spend their time digging for valuable business trends rather than begging engineering teams to fix broken spreadsheets or run manual database extracts. This boosts overall team productivity.
Improved Collaboration
When data teams speak the same language and use integrated platforms, friction disappears. Projects that used to stall for months due to poor communication are completed in days.
More Accurate Business Decisions
Faster insights mean decisions are backed by fresh data, minimizing errors caused by relying on outdated market perspectives.
Common Challenges That DataOps Resolves
Many organizations operate with broken data systems without realizing it. DataOps directly targets and resolves these fundamental problems:
- Data Silos: Different departments (like sales, marketing, and finance) often lock their data away in separate systems. DataOps builds bridges between these environments to create a unified view.
- Manual Workflows: Relying on human engineers to copy files, clean spreadsheets, or write custom scripts creates massive bottlenecks and invites typos.
- Poor Data Quality: Without automated checks, duplicate entries, missing fields, and formatting errors slip through unnoticed, muddying final reports.
- Legacy Systems: Older databases struggle to keep up with modern data volumes. DataOps wraps these systems in automated workflows to keep them functioning efficiently alongside newer cloud tools.
- Slow Pipeline Performance: Unoptimized database queries cause data delivery to drag, delaying critical daily reports.
- Lack of Automation and Integration Complexity: Connecting a dozens of different applications manually is messy. DataOps provides a structured framework to integrate tools systematically.
Best Practices for Improving Time-to-Insights
If your company wants to leverage DataOps to accelerate its analytics, focus on these practical strategies:
- Start Small: Do not try to automate your entire corporate database infrastructure overnight. Pick one high-value pipeline—such as your daily customer checkout report—and optimize that first.
- Automate Testing Early: Add simple validation tests to your ingestion process to check for missing values or unexpected formats before the data moves downstream.
- Encourage Cross-Functional Communication: Set up brief weekly meetings between data engineers who build pipelines and the business analysts who use the final dashboards to align goals.
- Invest in Cloud-Native Tools: Utilize cloud platforms that scale up instantly when processing massive datasets and scale back down to save costs when the work is complete.
- Focus on Data Lineage: Ensure your team documents data origins clearly so anyone can audit the path of an analytical insight without submitting formal IT support requests.
Real-World Use Cases
Banking
- Challenge: A retail bank wanted to offer personalized loan options, but processing credit scores and customer history took over a week.
- DataOps Solution: They implemented automated data orchestration to instantly gather and validate consumer background data from multiple secure sources.
- Business Outcome: The time-to-insight for loan risk profiles dropped from seven days to under ten minutes, letting the bank approve safe loans instantly online.
Healthcare
- Challenge: A hospital network needed to track emergency room occupancy to allocate staff, but data updates were delayed by 24 hours.
- DataOps Solution: The engineering team built real-time analytics pipelines with continuous monitoring to handle patient check-in data securely.
- Business Outcome: Hospital administrators gained an instant view of patient traffic, cutting patient wait times by $18\%$ through smarter staffing.
Retail
- Challenge: A clothing chain struggled with stockouts on trendy items because inventory reports were compiled manually at the end of each week.
- DataOps Solution: They deployed automated cloud pipelines connecting point-of-sale registers directly to a central database.
- Business Outcome: Managers received automated daily alerts on fast-selling products, reducing lost sales from out-of-stock items by $22\%$.
Manufacturing
- Challenge: A factory floor experienced frequent machinery breakdowns because sensor data logs were only audited monthly.
- DataOps Solution: DataOps engineers set up continuous data ingestion paired with automated data observability tools to watch sensor spikes.
- Business Outcome: The factory shifted to predictive maintenance, identifying failing components days before a breakdown and saving millions in unplanned downtime.
Telecommunications
- Challenge: A mobile network provider couldn’t quickly identify why call drops were spiking during major public events.
- DataOps Solution: They implemented a scalable DataOps framework with automated streaming analytics to process tower network logs instantly.
- Business Outcome: Engineers isolated tower overloads within minutes rather than days, maintaining reliable service during busy festivals.
E-commerce
- Challenge: An online store wanted to run real-time dynamic pricing discounts but their database took 12 hours to calculate competitor price shifts.
- DataOps Solution: They automated their competitive intelligence pipelines using version-controlled, continuous integration scripts.
- Business Outcome: The store updated its pricing structures automatically throughout the day, boosting digital sales margins by $14\%$.
Marketing Analytics
- Challenge: A digital marketing agency spent the first five days of every month copying ad performance statistics into manual slide decks for clients.
- DataOps Solution: They built an automated reporting workflow that integrated major ad platforms directly into automated customer dashboards.
- Business Outcome: Clients viewed their campaign performance live at any moment, and account managers reclaimed 40 hours of manual work every month.
Future Trends in DataOps and Analytics
The field of DataOps continues to evolve rapidly. Staying aware of these trends will help organizations protect their data systems for the long term.
- AI-Powered DataOps & Intelligent Automation: Artificial intelligence is being woven into pipelines to automatically patch broken data streams, optimize slow queries, and write pipeline code without human intervention.
- Self-Healing Data Pipelines: Future systems won’t just alert an engineer when a pipeline breaks. They will look at the issue (like a shifted text column) and fix the underlying format error dynamically.
- Cloud-Native DataOps: As data storage shifts completely to multi-cloud platforms, DataOps tools are becoming lightweight, modular, and deeply integrated into cloud architectures.
- Predictive Analytics expansion: Faster data pipelines enable companies to run machine learning models constantly, turning raw current statistics into accurate future forecasts instantly.
- Data Fabric and Data Mesh: These modern architectural styles treat data as a decentralized product. Instead of dumping everything into one giant lake, separate business units manage their own data pipelines using unified DataOps quality standards.
Comparison Tables
Traditional Analytics vs. DataOps-Driven Analytics
| Feature | Traditional Analytics | DataOps-Driven Analytics | Business Impact |
| Data Refresh Speed | Weekly or monthly batch processing | Real-time or continuous updates | Decisions are made on fresh data rather than old history. |
| Pipeline Testing | Manual sampling or done after a crash | Continuous, automated testing at every step | Errors are caught immediately, avoiding broken dashboards. |
| Team Collaboration | Isolated silos with poor communication | Unified, collaborative workflow | Projects are completed faster with fewer misunderstandings. |
| Error Resolution | Days spent searching through code manually | Instant root-cause discovery via observability | Minimized downtime for vital business intelligence tools. |
Manual Data Workflow vs. Automated DataOps Workflow
| Workflow Stage | Manual Process | DataOps Automation | Time Savings |
| Data Ingestion | Custom coding scripts written by hand | Pre-built automated connectors | Saves hours or days per new data source. |
| Data Cleaning | Sorting and fixing records in spreadsheets | Automated validation rules | Eliminates tedious daily scrubbing tasks. |
| Deployment | Manually copying code to live servers | CI/CD automated deployment pipelines | Reduces deployment time from weeks to minutes. |
| Incident Response | Waiting for user complaints about bad data | Automated alerts from observability tools | Catches errors instantly before users ever see them. |
FAQs
What is the main difference between DevOps and DataOps?
DevOps focuses on automating the software development lifecycle to build applications faster. DataOps borrows those same concepts but applies them to managing data pipelines, improving data quality, and accelerating data analytics workflows.
Does DataOps replace data engineering?
No, DataOps does not replace data engineering. Instead, it provides data engineers with better tools, automation strategies, and collaborative mindsets so they can build stronger pipelines with less manual effort.
How does DataOps help business analysts?
DataOps ensures that the data driving dashboards is clean, accurate, and constantly updated. This means business analysts spend less time dealing with broken reports and more time uncovering valuable insights.
What is data observability in simple terms?
Data observability is like a health monitor for your data system. It tracks your pipelines continuously to ensure data is flowing normally, arriving on time, and free from unexpected formatting errors.
Can small businesses benefit from DataOps?
Yes. While large enterprises handle massive datasets, small businesses still lose time to manual reporting and broken spreadsheets. Implementing basic DataOps principles like automated ingestion saves small businesses valuable time.
How does DataOps improve data quality?
DataOps introduces continuous testing along the entire pipeline. If dirty, corrupt, or missing data enters the system, automated tests flag it instantly, keeping it from reaching final business dashboards.
What are the most common tools used in DataOps?
DataOps relies on a mix of version control software (like Git), workflow orchestration engines, data transformation tools, and automated data observability platforms.
How long does it take to see results from DataOps?
If a team starts small by automating a single broken data pipeline, they can often see measurable reductions in processing time and manual errors within a few weeks.
What is data lineage and why is it useful?
Data lineage is a visual map showing where data originates and how it changes over time. It helps teams audit reports quickly and locate the exact source of an analytics error.
Is DataOps tied to a specific cloud vendor?
No. DataOps is a vendor-neutral methodology. Its principles can be applied using open-source tools, on-premise hardware, or any major public cloud ecosystem.
Conclusion
In today’s fast-moving economy, the speed at which a company extracts meaning from its data determines its success. A long time-to-insights acts as a drag on corporate growth, stalling decisions and leaving teams reacting to old news. DataOps addresses this challenge head-on by bringing structure, automation, continuous monitoring, and clear collaboration to the modern analytics workflow. By eliminating manual pipelines and replacing them with robust, automated data factories, DataOps ensures high data quality and dependable uptime. Business leaders gain access to reliable real-time analytics, allowing them to make smarter business choices, elevate customer experiences, and uncover operational efficiencies with complete confidence. Embracing a DataOps framework isn’t just about adopting new software; it’s about building an agile, data-driven foundation ready for the future.
