Introduction
In today’s digital economy, organizations are swimming in vast oceans of data. Every click, swipe, purchase, and IoT sensor log generates information that could potentially optimize a business. However, raw data scattered across isolated platforms is practically useless. To turn this raw material into actionable intelligence, companies must move, clean, and structure it safely. They rely on an end-to-end data pipeline to transport data seamlessly from diverse source systems into central repositories like dashboards, analytics platforms, and machine learning models. Historically, building these pipelines was a fragile process prone to frequent breakages, silent data corruption, and painful deployment delays. This is where DataOps enters the picture. By applying agile development principles, continuous integration, and automated testing to data workflows, DataOps elevates the speed, quality, and long-term reliability of these pipelines.
2. What Is an End-to-End Data Pipeline?
Definition and Purpose
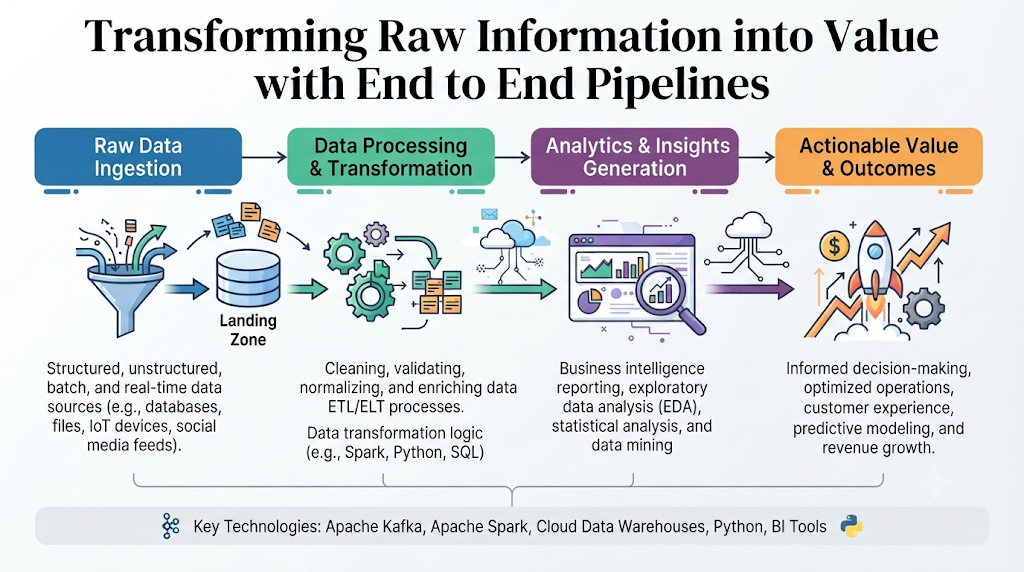
Think of an end-to-end data pipeline as a highly sophisticated digital plumbing system. At its core, it is a connected sequence of automated processes that extracts raw data from its origin, modifies it into a usable format, and delivers it to a destination where users can query it. The ultimate purpose is to ensure that fresh, accurate data flows continuously to the people and applications that need it to make decisions.
[ Data Sources ] ---> [ Ingestion & Validation ] ---> [ Transformation ] ---> [ Storage & Observability ] ---> [ Analytics/BI ]
Why Businesses Need End-to-End Pipelines
Without an organized, end-to-end pipeline, data sits trapped in operational silos. Business analysts waste hours manually downloading CSV files, running messy spreadsheets, and discovering late that their formulas were broken. End-to-end pipelines eliminate this manual chaos by creating a standardized, repeatable pathway. This allows businesses to scale their analytics effortlessly, maintain a single version of truth, and uncover revenue-generating insights without human intervention.
3. What Is DataOps?
Definition and Core Principles
DataOps (Data Operations) is not a single piece of software; it is a cultural and operational methodology. It focuses on improving the quality and reducing the cycle time of data analytics.
The core principles of DataOps include:
- Continuous Delivery: Deploying pipeline changes frequently and safely.
- Automation: Automating tests, deployments, and environment setups to remove human error.
- Data Quality Assurance: Monitoring code and data anomalies continuously.
- Collaboration: Breaking down walls between data engineers, data scientists, and business users.
The DataOps Lifecycle
The DataOps lifecycle functions as a continuous feedback loop: Plan → Code → Build → Test → Deploy → Monitor → Orchestrate.
   +---------> Plan ---------+
   |                         |
Monitor                    Code
   ^                         |
   |                         v
Orchestrate                Build
   ^                         |
   |                         v
   +-- Deploy <--- Test <----+
Instead of building a data pipeline once and hoping it never breaks, a DataOps framework assumes that data, business requirements, and underlying schemas will constantly change. It builds structural guardrails around the pipeline so teams can adapt instantly without crashing the systems.
DataOps vs. DevOps vs. Data Engineering
It is easy to confuse these terms, but they serve distinct purposes:
- Data Engineering is the act of designing, building, and maintaining the systems that store and move data.
- DevOps is the software engineering practice of automating software application delivery and infrastructure management.
- DataOps borrows the automation, version control, and testing philosophies of DevOps and applies them directly to the unique challenges of Data Engineering (such as managing unpredictable data volumes and shifting schemas).
4. Stages of an End-to-End Data Pipeline
To better understand how data moves, let’s look at each stage of a pipeline through a simple analogy: running a commercial juice factory.
1. Data Sources
This is where everything begins. Data sources are the raw inputs, such as transactional databases, third-party marketing APIs, cloud applications, or customer clickstreams.
- Juice Factory Analogy: The independent farms growing raw apples, oranges, and berries.
2. Data Ingestion
Ingestion is the collection phase. Data is pulled or pushed from the sources into the entry gate of your data platform. This can happen in scheduled batches or via real-time streams.
- Juice Factory Analogy: Loading the fruit onto trucks and delivering them to the factory loading docks.
3. Data Validation
Before processing, the system checks if the incoming data matches basic formatting assumptions. If a file is corrupted or contains completely wrong values, it is flagged early.
- Juice Factory Analogy: Inspectors sorting through the fruit to throw away rotten pieces before they touch the machinery.
4. Data Transformation
Raw data is rarely structured cleanly. During transformation, engineers clean up missing records, mask sensitive data, filter out noise, and format dates uniformly.
- Juice Factory Analogy: Peeling, washing, and chopping the fruit so it is ready for juicing.
5. Data Integration
This phase combines multiple transformed datasets into a unified framework, linking separate records (like matching a customer’s website clicks with their in-store purchase history).
- Juice Factory Analogy: Blending the separate apple and berry juices into a delicious fruit punch recipe.
6. Data Storage
The integrated data is saved into scalable storage systems, such as a Data Lake for raw files or a Data Warehouse for highly structured tables.
- Juice Factory Analogy: Pouring the blended juice into sterile holding tanks or bottling units.
7. Data Processing
Here, computing engines execute heavy analytical queries, aggregations, and summerizations to prep the stored data for high-speed use.
- Juice Factory Analogy: Packaging the bottles into organized boxes categorized by store destination.
8. Data Quality Checks
Automated software scans the processed data to ensure the numbers make structural and logical sense before human eyes see them (e.g., checking that a column for “age” does not contain negative numbers).
- Juice Factory Analogy: Running a final lab test on a bottle sample to confirm it meets food safety standards.
9. Data Observability
Observability provides constant tracking across the entire health of the system. It tracks things like how fast the data is moving, volume shifts, and structural schema changes.
- Juice Factory Analogy: Setting up dashboards and digital sensors along the conveyor belts to spot if a machine is clogging or slowing down.
10. Analytics and Reporting
The final destination. Cleaned, monitored data is pulled into Business Intelligence (BI) dashboards, operational reports, or machine learning models to drive strategic actions.
- Juice Factory Analogy: Delivering the final bottled juice to store shelves for customers to enjoy.
5. Technologies Used in Data Pipelines
Building a pipeline requires selecting the right tools for the job. Modern architectures generally use a combination of the following components:
- ETL (Extract, Transform, Load): The traditional method where data is extracted from sources, cleaned on a separate staging server, and then loaded into a warehouse.
- ELT (Extract, Load, Transform): The modern cloud approach. Raw data is dumped directly into a high-powered cloud warehouse first, and transformations are executed using the warehouse’s own computing power (using tools like dbt).
- Workflow Orchestration: Software like Apache Airflow, Prefect, or Dagster acts as the conductor of the pipeline orchestra. It schedules tasks, tracks dependencies, and ensures Stage B only runs after Stage A finishes successfully.
- APIs (Application Programming Interfaces): The communication gateways that allow data pipelines to securely pull information out of software platforms (like Salesforce or Google Analytics).
- Data Lakes: Cheap, vast storage pools (like Amazon S3 or Azure Blob Storage) designed to hold raw, unstructured data in its native format.
- Data Warehouses: High-performance, structured relational databases (like Snowflake, Google BigQuery, or Amazon Redshift) optimized for fast analytical queries.
- Streaming Platforms: Infrastructure like Apache Kafka or Amazon Kinesis that processes continuous streams of data instantly as events happen, rather than waiting for midnight batches.
- Batch Processing: Execution frameworks (like Apache Spark or cloud cron jobs) that process large groups of data collected over a specific period all at once.
- Cloud Storage: The underlying, highly durable virtual hard drives that host data lakes and staging environments across global data centers.
- Monitoring and Observability Tools: Specialized software platforms (like Datadog, Monte Carlo, or OpenLineage) that alert engineers the moment a pipeline stalls, experiences data drift, or drops critical records.
6. Benefits of End-to-End Data Pipelines
Implementing automated, DataOps-driven pipelines brings widespread benefits to an enterprise:
- Faster Analytics: Automating data delivery means analysts no longer wait days for custom reports; insights are ready on demand.
- Better Data Quality: Automated verification steps scrub errors out of the system before they can skew company metrics.
- Improved Reliability: If a source system goes offline temporarily, modern pipelines can retry automatically without breaking downstream dashboards.
- Automation: Frees up talented data engineers from performing repetitive maintenance tasks, allowing them to focus on high-value development.
- Better Collaboration: DataOps uses version control tools like Git, meaning data analysts and software developers can work together on the same pipeline codebase without stepping on each other’s toes.
- Scalability: Cloud-native storage and compute power allow pipelines to process gigabytes or petabytes of data with equal ease.
- Regulatory Compliance: Structured tracing tracks where data came from and who modified it, making it easier to comply with strict laws like GDPR and CCPA.
- Faster Business Decisions: Executives can make aggressive, confident moves in the market based on real-time operational facts, rather than relying on gut feelings.
7. Common Challenges in Data Engineering
Building these structures is not without hurdles. Teams frequently run into several persistent problems:
- Poor Data Quality: The classic “garbage in, garbage out” dilemma. If upstream apps capture bad input data, downstream analytics will suffer.
- Pipeline Failures: Network drops, API credential expirations, and cloud server outages can stall workflows unexpectedly.
- Schema Changes: If a software developer changes a database column name from
user_idtocustomer_uuidwithout telling the data team, downstream pipelines will immediately crash. - Data Latency: Struggling to balance real-time data needs against the cheaper compute costs of nightly batch jobs.
- Monitoring Complexity: As an enterprise grows to manage hundreds of distinct pipelines, knowing exactly where a failure occurred becomes incredibly difficult without advanced observability tools.
- Security and Privacy: Ensuring that personally identifiable information (PII), like credit card numbers, is masked instantly at the ingestion phase.
- Integration Issues: Trying to connect old, legacy on-premise mainframes with modern cloud environments.
- Cost Management: Running continuous cloud transformations can lead to runaway cloud compute bills if queries are written inefficiently.
8. DataOps Best Practices
To prevent these challenges from derailing your operations, implement these foundational DataOps practices:
- Automate Testing: Treat data exactly like application code. Write automated tests that check for row counts, null values, and correct data types every time the pipeline executes.
- Monitor Continuously: Set up proactive alerting systems (via Slack or email) to ping the engineering team the second a pipeline task fails or runs unusually slow.
- Validate Early and Often: Catch bad data at the boundary. Do not wait until data reaches your warehouse to realize a source file was empty.
- Use Version Control: Store all pipeline configurations and transformation queries in a repository like GitHub. This allows you to track historical updates and roll back breaking changes instantly.
- Build Reusable Pipelines: Avoid writing custom code for every single data source. Design modular, parameterized ingestion templates that can be repurposed easily.
- Document Workflows: Maintain clear, up-to-date data dictionaries and visual lineage maps so anyone in the organization can understand where a specific metric comes from.
- Implement Governance: Enforce strict access controls so only authorized users can view sensitive data layers.
- Optimize Performance: Periodically review database indexing, clustering, and transformation logic to minimize computational waste and lower cloud bills.
9. Real-World Examples
E-Commerce
- Business Challenge: A massive online retailer was plagued by cart abandonment issues. Their marketing team could not target users with follow-up emails fast enough because their web store logs were processed in slow batch loads every 24 hours.
- Pipeline Workflow: They deployed a real-time streaming pipeline using Apache Kafka to ingest clickstream events instantly, process them through cloud functions, and load them into a live analytics layer.
- DataOps Improvements: Automated regression testing was put in place to ensure that holiday traffic spikes did not break data validation steps.
- Business Outcome: The team reduced data latency from 24 hours to less than 45 seconds, enabling immediate, automated cart-abandonment discount emails that boosted sales conversions by 14%.
Retail Banking
- Business Challenge: A commercial bank struggled with fraudulent credit card transactions because their fraud detection models were operating on delayed batch files, missing active scams.
- Pipeline Workflow: They constructed an end-to-end pipeline that routes live point-of-sale transactions directly into machine learning inference engines.
- DataOps Improvements: Continuous data observability tools were configured to watch for data drift and alert engineers if transaction payload structures suddenly shifted.
- Business Outcome: The bank stopped millions of dollars in fraudulent charges in mid-transaction, protecting their customers and lowering insurance payouts.
Healthcare
- Business Challenge: A multi-hospital network struggled to track patient readmission rates accurately because medical records were trapped in separate, legacy software platforms across different clinics.
- Pipeline Workflow: An ELT pipeline extracted data from various electronic health record databases, safely consolidated the records inside a secure cloud data warehouse, and stripped out sensitive patient identifiers.
- DataOps Improvements: Programmatic compliance checks were built directly into the continuous integration flow to prevent any accidental HIPAA data exposure.
- Business Outcome: Medical directors gained a unified, daily dashboard of readmission rates, leading to immediate changes in post-discharge care protocols.
10. Future Trends in DataOps
As we look toward the future of data architecture, several groundbreaking trends are redefining the industry:
- AI-Powered DataOps: Machine learning models are starting to write basic pipeline transformations, optimize cloud data warehouse storage layouts automatically, and predict failures before they happen.
- Self-Healing Pipelines: Future data systems will automatically correct simple errors—like dynamically adjusting to an altered source schema or scaling up compute instances during unexpected volume spikes—without human intervention.
- Data Mesh and Data Fabric: A structural shift away from single, massive centralized data teams toward decentralized architectures. In a Data Mesh, individual business domains (like Product, Finance, or Sales) own and manage their own end-to-end pipelines as individual products.
11. Comparison Tables
Comparison Table 1: Traditional Data Pipelines vs. DataOps End-to-End Pipelines
| Feature | Traditional Pipeline | DataOps Pipeline | Business Benefit |
| Testing | Manual, infrequent, or reactive after crashes occur. | Automated, continuous across every step of the pipeline. | Catches data errors early before bad numbers reach dashboards. |
| Deployment Speed | Months of slow manual reviews and fragile deployments. | Minutes via automated continuous delivery pipelines. | Introduces new features and reports to market instantly. |
| Error Handling | Pipelines break silently, creating hidden data corruption. | Proactive data observability alerts engineering teams immediately. | Eliminates silent data bugs and builds deep trust in analytics. |
| Collaboration | Siloed teams working across isolated environments. | Unified workflows using Git and shared tracking tools. | Streamlines communications and speeds up project delivery. |
Comparison Table 2: Stages of an End-to-End Data Pipeline
| Pipeline Stage | Primary Purpose | Common Technologies | Business Value |
| 1. Data Sources | Generate operational data from business activities. | PostgreSQL, Salesforce, IoT Devices | Captures raw operational interactions across the business ecosystem. |
| 2. Data Ingestion | Extract and move raw data into the analytical stack. | Apache Kafka, Fivetran, Airbyte | Bridges the gap between operational tools and analytical systems. |
| 3. Data Transformation | Clean, shape, filter, and format unstructured raw data. | dbt (Data Build Tool), Apache Spark | Converts confusing raw inputs into clean, standardized metrics. |
| 4. Data Storage | Securely save analytical assets for downstream queries. | Snowflake, BigQuery, Amazon S3 | Creates a highly secure, scalable single version of truth. |
| 5. Data Observability | Continuously track system health, quality, and lineage. | Monte Carlo, Datadog, OpenLineage | Guarantees reliability and high uptime for business applications. |
| 6. Analytics / BI | Serve operational insights to human decision-makers. | Tableau, Power BI, Looker Studio | Drives profitable, data-backed strategic business actions. |
13. FAQs
Q1: What is the main difference between a data pipeline and an ETL pipeline?
A: A data pipeline is a broad, overarching term for any system that moves data from one place to another. An ETL (Extract, Transform, Load) pipeline is a specific sub-category of a data pipeline that includes transforming the data before saving it into its final location.
Q2: Can beginners start learning DataOps without a software engineering degree?
A: Absolutely. While having a programming background helps, beginners can enter the field by mastering data fundamentals, learning SQL for transformations, and understanding basic workflow orchestrators through platforms like DataOpsSchool.com.
Q3: How does data observability differ from simple pipeline monitoring?
A: Pipeline monitoring simply tells you if a system task succeeded or failed (e.g., “Did the file upload?”). Data observability goes deeper by checking the health of the actual data inside the system, flagging things like unexpected distribution changes or empty rows even if the pipeline itself ran without crashing.
Q4: Why is Git version control necessary in a DataOps pipeline?
A: Git tracks every code change made to your transformations and pipeline configurations. If an engineer writes a broken query that ruins a dashboard, the team can review the history and roll back the code to a working state instantly.
Q5: What is schema drift, and why does it cause pipeline issues?
A: Schema drift happens when a source system alters its database structure—like deleting a column or changing a data type—without updating the downstream team. This breaks static pipelines because the automated processing code expects the old layout.
Q6: Is a data lake better than a data warehouse for end-to-end pipelines?
A: Neither is objectively “better” because they serve different needs. A data lake is excellent for storing massive amounts of raw, unstructured data cheaply, while a data warehouse is optimized for structured data and incredibly fast SQL search performance.
Q7: How often should data quality checks run?
A: Ideally, data quality checks should run continuously at multiple stages of the pipeline—immediately after ingestion, during transformation phases, and right before data is exposed to production dashboards.
Q8: What exactly does a workflow orchestrator do?
A: A workflow orchestrator acts as a project manager for your data pipeline. It schedules when tasks run, ensures steps run in the correct chronological order, and sends out alerts if a specific task stalls or fails.
Q9: How do real-time data pipelines differ from batch pipelines?
A: Batch pipelines process data in chunks at scheduled intervals (such as every midnight), which is highly cost-effective. Real-time pipelines process data continuously as events occur, which is necessary for instant use-cases like fraud detection.
Q10: Can small startups benefit from DataOps, or is it only for massive corporations?
A: Startups benefit immensely from DataOps. Implementing lightweight automation and testing early prevents technical debt, keeping small data teams fast and efficient as the business scales.
14. Conclusion
End-to-end data pipelines serve as the operational backbone of modern, data-driven enterprises. By establishing a clear, automated route from raw data sources straight to dashboards, companies can eliminate manual bottlenecks and uncover insights at scale.
However, technology alone cannot ensure success. DataOps strengthens these pipelines by introducing a culture of automation, continuous testing, cross-team collaboration, and comprehensive data observability. This disciplined approach ensures that your data streams stay clean, reliable, and functional even when business requirements change. By committing to a strong DataOps framework, organizations can minimize pipeline downtime and confidently make fast, data-backed decisions that drive growth.
