Every single day, modern organizations rely on an astronomical amount of data to make critical business decisions. Whether it is an e-commerce platform updating its inventory, a bank flag-checking fraudulent transactions, or a streaming service recommending your next favorite show, data runs the world. To move this data from one place to another, engineers build complex networks known as data pipelines. But what happens when a pipeline breaks silently, transferring corrupted or incomplete data to your business dashboards? This is where the concept of observability enters the picture. You can learn more about these foundational systems and modern data practices at DataOpsSchool.com. For a long time, teams relied on basic monitoring to tell them when a pipeline crashed. However, in today’s fast-paced DataOps environment, simply knowing that something broke is not enough. You need to know why it broke, where the data went wrong, and how it impacts the rest of your systems.
What Is Pipeline Observability?
Definition
Pipeline observability is the practice of gaining deep, real-time insight into the internal state of your data pipelines by analyzing the external outputs they produce. It allows data teams to fully understand the health, performance, and quality of data as it travels across various systems.
Purpose
The primary purpose of pipeline observability is to ensure data reliability. It moves data teams away from reactive firefighting (fixing things after they break) and shifts them toward proactive management. By observing how data changes and flows, teams can catch subtle anomalies before they turn into major business disruptions.
Basic Concepts
At its core, observability relies on gathering detailed context from your workflows. Instead of just checking if a job status says “Success” or “Failure,” observability looks at the bigger picture. It examines data volume trends, execution times, system dependencies, and structural changes in the data itself.
The Difference Between Monitoring and Observability
It is common for beginners to confuse monitoring with observability, but they are fundamentally different.
Data pipeline monitoring tells you what is happening. It tracks predefined metrics and alerts you when a threshold is crossed—for example, sending an email if a server shuts down or a job fails.
Pipeline observability, on the other hand, tells you why something is happening. It provides the deeper context needed to troubleshoot unpredictable problems that you did not explicitly plan for. Monitoring looks for “known-unknowns,” while observability helps you uncover “unknown-unknowns.”
Why Pipeline Observability Matters
Implementing observability into your data infrastructure yields several major benefits:
- Data Reliability: When your data pipelines are observable, you can guarantee that the information landing in your warehouses is clean, accurate, and trustworthy.
- Faster Issue Detection: Instead of waiting for a business analyst to complain that a dashboard looks wrong, observability tools alert data engineering teams the exact moment an anomaly occurs.
- Better Business Decisions: Executives rely on data to steer the company. Ensuring high data quality monitoring directly protects the integrity of those corporate decisions.
- Improved System Performance: By tracking pipeline health over time, teams can spot slow-moving bottlenecks and optimize their Extract, Transform, Load (ETL monitoring) or ELT pipelines for better efficiency.
- Reduced Downtime: When errors occur, having deep visibility means your team can pinpoint the root cause in minutes rather than spending days digging through messy logs.
How Data Pipelines Work
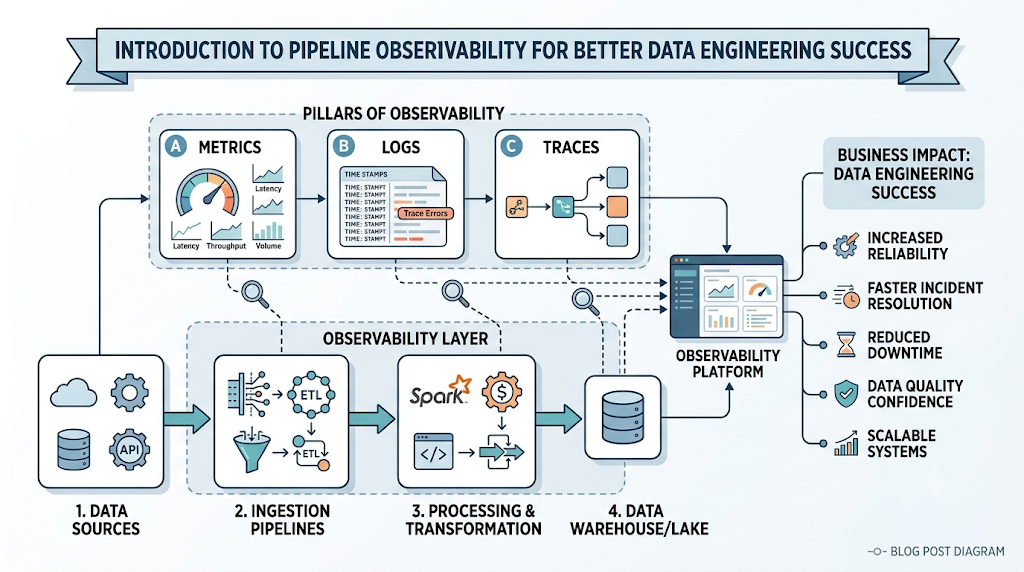
To understand how to observe a pipeline, we must first look at the journey data takes from start to finish. A typical data engineering workflow consists of six major stages:
[Data Collection] ➔ [Data Ingestion] ➔ [Data Transformation]
                                              ➔ [Data Validation] ➔ [Data Storage] ➔ [Data Consumption]
1. Data Collection
This is the initial stage where data is generated. It could come from user interactions on a website, IoT sensor logs, or traditional transactional databases.
2. Data Ingestion
During ingestion, the raw data is moved from its original source into the data architecture. This can happen in real-time batches or via streaming protocols.
3. Data Transformation
Raw data is rarely ready for analysis. In this phase, data engineering workflows clean, filter, aggregate, and restructure the data so it matches the target system’s requirements.
4. Data Validation
Before data is permanently saved, data quality checks run to ensure the information complies with specific rules (e.g., verifying that a “User ID” column does not contain blank spaces).
5. Data Storage
The cleaned and validated data is written into a centralized repository, such as a cloud data warehouse, a data lake, or an operational database.
6. Data Consumption
Finally, the data is put to work. Data scientists run machine learning models, business intelligence (BI) tools refresh corporate dashboards, and applications pull the data to serve end-users.
Core Components of Pipeline Observability
Achieving true visibility across all six stages requires a mix of technical capabilities. These are often referred to as the pillars of observability:
- Metrics: Numeric values measured over time, such as CPU usage, processing duration, and the total number of records processed.
- Logs: Text-based records generated by your software that describe specific events occurring at a precise moment in time.
- Traces: Information that tracks a specific piece of data or a request as it travels across different distributed systems and services.
- Alerts: Automated notifications sent to engineers when system behaviors deviate from expected baselines.
- Data Quality Checks: Programmatic tests that verify if data meets business rules regarding format, range, and completeness.
- Lineage: A visual map that shows the history of your data—where it came from, how it changed, and where it is going.
- Dashboards: Visual interfaces that aggregate your metrics, logs, and statuses into easy-to-read charts for quick analysis.
Common Pipeline Observability Metrics
When setting up your data workflow monitoring, you should focus on these essential metrics:
- Pipeline Success Rate: The percentage of scheduled pipeline runs that complete without throwing errors.
- Failure Rate: The frequency at which data jobs crash or stop unexpectedly.
- Latency: The total time it takes for a piece of data to travel from the collection point to the final storage destination.
- Throughput: The volume of data processed by the pipeline within a specific timeframe (e.g., gigabytes per hour).
- Freshness: An indicator of how up-to-date your data is, measuring the time gap between when the event happened and when it became available for analysis.
- Completeness: A metric checking whether all expected data arrived, ensuring no rows or columns were dropped along the way.
- Accuracy: A measure of whether the data values match the real-world truths they represent.
- Availability: The percentage of time that your data infrastructure systems are operational and accessible to run jobs.
Benefits of Pipeline Observability
Investing in observability transforms how your DataOps team operates day-to-day.
First, it enables early issue detection. Instead of finding out about a bug because the CEO noticed an empty chart, your system flags the variance silently in the background. Second, it yields better troubleshooting. With complete data lineage and traces, you do not have to guess which transformation step corrupted a column; you can see the exact line of code responsible.
Ultimately, this creates improved reliability and higher data quality, giving your entire company confidence in the metrics they use. Over time, your operational efficiency skyrockets because engineers spend less time fixing broken pipelines and more time building new features.
Common Challenges
While the benefits are clear, implementing these practices comes with unique hurdles:
- Complex Pipelines: Modern data stacks involve dozens of tools across multi-cloud systems, making it difficult to stitch together a unified view.
- Missing Visibility: Legacy systems and third-party SaaS applications often hide their internal operations, creating blind spots in your pipeline health.
- Alert Fatigue: If your alerting rules are too sensitive, engineers will receive hundreds of notifications a day, causing them to ignore critical warnings.
- Data Inconsistencies: Data formats shift constantly without warning, causing downstream transformations to break unexpectedly.
- Performance Bottlenecks: As data volumes scale up, the observability tools themselves can sometimes slow down the actual data delivery.
- Scalability: Managing and storing the massive amounts of logs and traces generated by large data systems can become costly and complex.
Best Practices
To successfully introduce observability to your organization, keep these practical tips in mind:
- Start Small: Do not try to observe everything at once. Focus on your most critical data assets first—the ones that power your primary business reports.
- Automate Your Checks: Integrate automated data quality testing directly into your continuous integration and deployment (CI/CD) pipelines.
- Define Clear Baselines: Analyze your historical data trends so you know what “normal” looks like before setting up automated alerts.
- Enforce End-to-End Lineage: Ensure your team maps data pathways from the source system all the way to the final dashboard.
- Collaborate Across Teams: Connect data engineers, analytics professionals, and business stakeholders to agree on what constitutes high-quality data.
Popular Pipeline Observability Tools
The marketplace for observability tools is expanding quickly. Generally, these tools fall into three main categories:
Open-Source Frameworks
These are community-driven, customizable tools that let you build your own infrastructure. Examples include Great Expectations for data quality testing and OpenLineage for tracking data paths.
Data Quality & Observability Platforms
Dedicated corporate platforms that connect directly to your data warehouses to monitor anomalies automatically. Popular examples include Monte Carlo, Databand (IBM), and Acceldata.
Cloud-Native Solutions
Major cloud providers offer built-in services to monitor resources. Tools like AWS CloudWatch, Google Cloud Monitoring, and Azure Monitor track infrastructure performance closely.
Real-World Use Cases
How does this look in practice? Let’s explore how different industries use observability:
- E-Commerce: An online retailer monitors ingestion latency during Black Friday to ensure product inventory updates sync across the site instantly.
- Banking: A financial institution uses real-time data workflow monitoring to guarantee credit card transaction logs reach fraud detection models within milliseconds.
- Healthcare: A hospital network applies data quality monitoring to patient records to avoid corrupted medical histories from affecting patient care.
- Manufacturing: A factory tracks IoT sensor pipelines to accurately predict when heavy machinery requires maintenance, avoiding costly floor closures.
- Marketing Analytics: A digital agency monitors API integrations with ad platforms to verify that campaign spending dashboards show accurate numbers.
- Business Intelligence: A corporate enterprise utilizes data lineage to trace revenue metrics back to raw ERP data during annual financial audits.
Future Trends
As technology advances, pipeline observability is evolving rapidly:
- AI-Powered Observability: Machine learning algorithms will automatically map your systems and infer complex operational contexts without manual configuration.
- Predictive Monitoring: Future tools will notify you that a pipeline is going to fail based on subtle historical signals before the crash even happens.
- Automated Anomaly Detection: Systems will dynamically adjust threshold limits, eliminating manual alert configurations and reducing alert fatigue.
- Cloud-Native DataOps: Observability features will come pre-integrated into cloud data warehouses, working silently out of the box.
- Real-Time Data Quality Monitoring: As businesses move toward streaming data, quality validations will happen mid-flight rather than after the data lands.
- Intelligent Alerting: Systems will automatically route specific alerts to the exact developer who wrote the broken code, speeding up resolution times.
Comparison Tables
Pipeline Monitoring vs. Pipeline Observability
| Feature | Pipeline Monitoring | Pipeline Observability | Business Impact |
| Core Focus | Asks: Is the pipeline working right now? | Asks: Why is the pipeline behaving this way? | Shifts team culture from reactive firefighting to proactive optimization. |
| Data Scope | Tracks simple status metrics, uptimes, and basic errors. | Tracks deep metrics, logs, execution traces, and structural data changes. | Provides full operational context, reducing troubleshooting times. |
| Problem Type | Solves known issues that you explicitly anticipated. | Discovers unexpected anomalies and silent failures. | Minimizes silent data corruption, protecting downstream analytics. |
| Approach | Reactive (notifies you after a failure occurs). | Proactive (identifies trends before systems break). | Increases total system uptime and raises user trust in data. |
Common Pipeline Observability Metrics
| Metric | What It Measures | Why It Matters | Example Use Case |
| Latency | Total duration for data to move from source to target. | Ensures time-sensitive applications receive data quickly. | Checking if credit card swipes reach fraud engines in under two seconds. |
| Freshness | The age of the most recent records in your database. | Keeps business dashboards up to date for accurate decisions. | Verifying that an e-commerce sales report updates every single hour. |
| Volume | The total number of rows or bytes processed in a run. | Catches unexpected drops or spikes in data delivery. | Alerting engineers if a daily log drop falls from 1 million rows to zero. |
| Completeness | The percentage of data values that are not missing or null. | Prevents broken fields from ruining downstream metrics. | Ensuring every customer profile record includes a valid email address. |
FAQs
What is the main difference between monitoring and observability?
Monitoring tells you when a specific pipeline system fails by tracking preconfigured metrics. Observability gives you the deep internal context needed to understand why an unexpected failure happened, even if you never created a specific rule for it.
Why is data lineage important for pipeline observability?
Data lineage creates a visual map showing the journey data takes through your systems. When a data error appears in a business dashboard, lineage allows you to trace back step-by-step to find the exact point where the info became corrupted.
Can beginners set up pipeline observability?
Yes, beginners can start by using open-source tools to add basic data quality checks and logging into their Python scripts or ETL pipelines, gradually scaling up to dedicated observability platforms over time.
What is alert fatigue in data engineering?
Alert fatigue happens when monitoring systems send too many low-priority notifications. When engineers are constantly flooded with alerts, they become desensitized and may accidentally ignore a critical warning about a major system failure.
How does observability improve data quality?
Observability constantly checks the structure and values of your data throughout the pipeline process. By catching anomalies, missing values, or formatting changes early, it stops bad data from reaching production systems.
What is the role of DataOps in observability?
DataOps focuses on automating and improving the quality and speed of data delivery. Pipeline observability provides the automated feedback loops, metrics, and system visibility that DataOps teams need to keep infrastructures running smoothly.
What does data freshness mean?
Data freshness measures how up-to-date your data is by tracking the time elapsed since the last successful data update. If a database hasn’t been refreshed in 24 hours, its data freshness score drops, signaling potential issues.
Are open-source observability tools difficult to use?
Many open-source tools have excellent documentation and active communities designed to help beginners. While they require manual configuration compared to paid platforms, they offer great flexibility for learning the core concepts.
How does cloud-native monitoring fit into observability?
Cloud-native tools monitor the underlying hardware and cloud infrastructure performance (like memory and CPU). While helpful, they should be combined with specialized data observability tools that check the actual health of the data running inside those systems.
Will AI replace the need for data engineers to manage observability?
AI will automate repetitive tasks like setting thresholds and finding anomalies, but it will not replace engineers. Data professionals will always be needed to interpret complex contexts, write custom business logic, and architect robust systems.
Conclusion
As modern organizations continue to build larger, more complex data systems, relying on basic monitoring tools is no longer enough to ensure success. Pipeline observability provides the deep, continuous insights required to build reliable, scalable, and trustworthy data architectures. By mastering the core components, tracking critical metrics, and adopting modern DataOps best practices, you can confidently protect your data pipelines against silent failures and erratic changes. Embracing these principles early ensures that your data engineering workflows remain efficient, transparent, and resilient for years to come.
